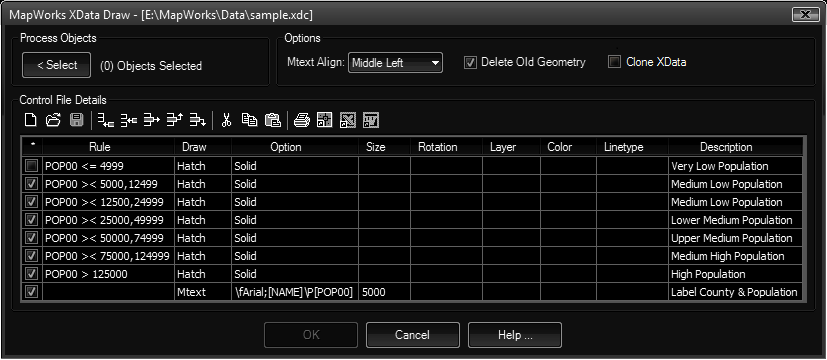
The tool will allow you to draw geometry such as hatches and text based on the values contained in the extended data. The most common source of this data is through ESRI Shape File imports.
Keyboard Command: EntDatDrw

An example is shown in the dialog capture (above) along with the resulting drawing (below). The data driving the color fills (hatches) is the population in the year 2000 (field POP00). Seven color ranges were established to show County population densities. A final record was used to label the County and the population. Notice this record had no rule field so all counties would be labeled.

Grid Columns:
- Toggle (*): Controls the active state of the row. This allows you to temporarily turn off codes you don't want processed.
- Rule: The expression to be evaluated to determine if an object meets the criteria. The rule is made up of three parts separated by spaces, the field name followed by the operator followed by the value. Some operators (such as between) need two values separated by a comma.
Op Description Values = Equal To 1 < Less Than 1 <= Less Than or Equal To 1 > Greater Than 1 >= Greater Than or Equal To 1 <> Not Equal To 1 >< Between 2 CO String Contains 1 IS String Is 1 SW String Starts With 1 EW String Ends With 1 To illustrate the >< (between) operator verbally, in row two of the dialog example, it says "If field POP00 is between 5000 and 12499 then ...".
- Draw: Specify the object to draw if the criteria is met.
- Hatch: Creates a hatch that fills the closed object. Use the Option field to specify the pattern name. Use the Size field to specify the pattern scale (if not using solid).
- Insert: Creates a block insert at the object centroid. The option field specifies the block name. A block with this name must already be defined in the current drawing. If the block definition contains attributes with tags that match the data fields, the information will be transferred (copied) to the block insert.
- Mtext: A middle-centered mtext object will be drawn at the object's centroid. The Option field specifies the template to use. Note that mtext control codes can be embedded. For example the \P is used to begin a new line. You can also use the font prefix to control the style, such as
\fArial;[NAME]\P[POP00]would use the Windows Arial font.
- Option: Used to set the pattern name, mtext template, etc.
- Size: Used to control the pattern scale, mtext height, etc. You can also use a data field, such as {HEIGHT}.
- Rotation: Used to control the rotation angle. You can use the {ANGLE} to specify the angle formed by the object's first two points.
- Layer: Specify the layer you want the geometry placed on. If the layer does not exist, it will be created. You can also use a data field.
- Color: Specify the color for the object. This will usually be "Bylayer".
- Linetype: Specify the linetype for the object. This will usually be "Bylayer" or "Continuous".
- Description: This can be any text to help you identify the purpose of the record.
Procedure:
- Open the drawing containing extended data or import a file (such as ESRI shape).
- Initiate this tool from the menu, ribbon or command above.
- Choose the button to choose objects to process.
- If desired, use the button to load a control file.
- Specify any additional options desired.
- Choose the button to begin.
Notes:
- When the Delete Old Geometry toggle is on, all geometry in the drawing previously created with XData Draw will be deleted before new geometry is created.
- The Clone XData option currently only works with inserts that are added to the drawing.
- This tool will float the boundary to the top of the generated hatches.
 Entity Data Draw