Introduction
Command Mobile is a companion application to Carlson Machine Control’s Command platform, designed to provide field personnel with fast, intuitive, and real-time access to active project data directly from their mobile devices. By extending the power of Command beyond the office, Command Mobile helps supervisors, grade checkers, foremen, and technicians stay connected with their machines, sites, and production metrics; anytime, anywhere.
With Command Mobile, users can:
- View site maps and machine locations on the go
- Access dashboards and machine data without needing a workstation
- Perform quick point collection with onboard mobile GNSS
- Upload files, photos, or point information directly from the field
- Monitor alerts, view machine status, and access real-time remote views
- Seamlessly stay synchronized with the main Command environment
This mobility enhances communication, speeds up decision-making, reduces the need for travel back to the office, and empowers field teams to respond faster to changing site conditions. As a result, Command Mobile strengthens the entire Command ecosystem by delivering situational awareness and productivity improvements precisely where they are needed most... on the job site.
Table of Contents
- Introduction
- Command Mobile Installation (iOS)
- Command Mobile Installation (Android)
- Login
- Home Screen (Map View)
- Points Screen
- Machine List Screen
- Project Loader
- Cut/Fill Loader
- Map Drawing
- Change Site
- File Upload
- Settings
- Alert Report
- Dashboard
- Drill Report
- Pile Report
Command Mobile Installation (iOS)
Compatible Devices (iOS)
Command Mobile is compatible with Apple iPhones, iPads, and iPod Touches running iOS 15.1 or later and is available on the Apple App Store.
Note: The app may install on other Apple devices but is not officially supported on them.
More Information - Download
Download (iOS)
Command Mobile for iOS can be downloaded at:
https://apps.apple.com/us/app/carlson-command/id6444068250

Tap the "Get" button to begin installation.
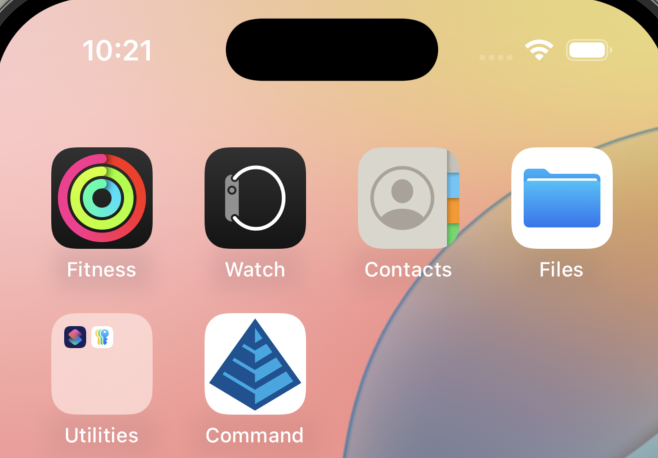
Once installed, the Command app icon appears on the device home screen.
Command Mobile Installation (Android)
Compatible Devices (Android)
Command Mobile is compatible with Phones and Tablets running Android 7.0 or newer and is available on the Google Play Store.
Note: The app may install on other Android devices but is not officially supported.
More Information - Download
Download (Android)
Command Mobile for Android can be downloaded at:
https://play.google.com/store/apps/details?id=com.command_mobile_ios

Tap the "Install" button to begin installation.
Once installed, the Command Mobile icon will appear on your device app list.

Login
Login Screen Interface Reference
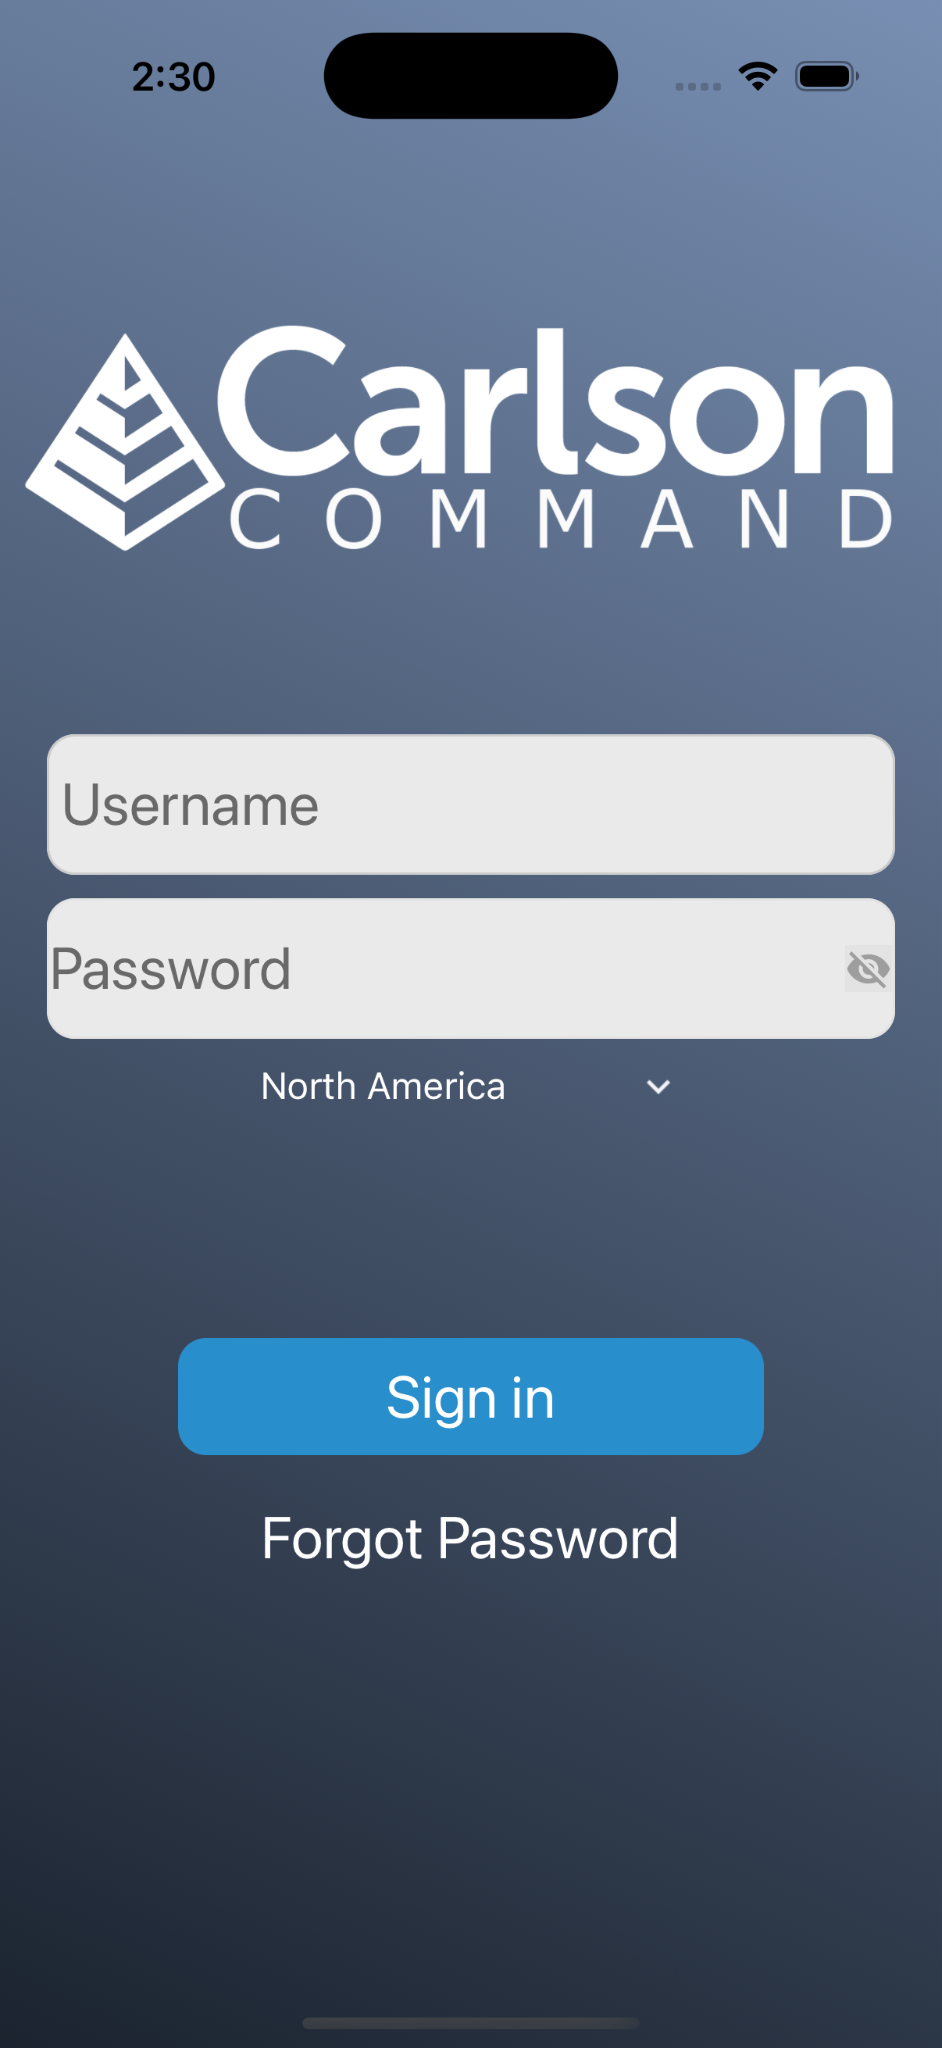
- Username: The same username that is used from Command Desktop.
- Password: The password associated with the entered username.
Note: The Eye icon can be tapped to show your password. By default, the password is hidden.
- Region Selection: On start, Command Mobile uses your location information to populate the region. The region setting is used to select the Command server.
More Information
Region Selection
Tapping the Region Selection displays a list of available regions. Tapping a region on this list changes to the selected region.
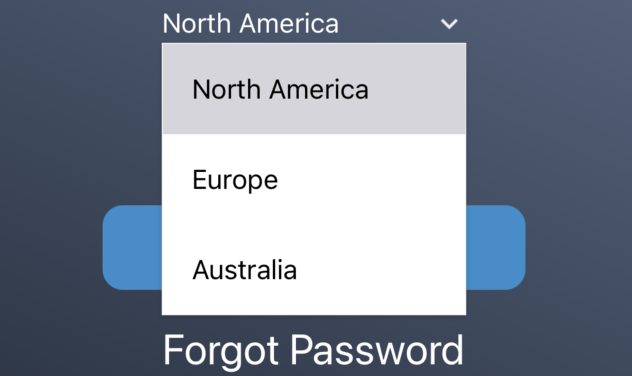
Region Selection Region Selection Reference
For optimal performance, choose the closest region.
Regional References Region Server North America carlsoncommand.com Europe europe.carlsoncommand.com Australia command.aptella.com Note: Command Mobile currently does not support custom servers.
- Sign in: This signs the user in. After successful authentication, the user is logged in. If authentication is unsuccessful, you are presented with an error and prompted to retry.
- Forgot Password: Takes user to the forgot password process.
More Information
Forgot Password
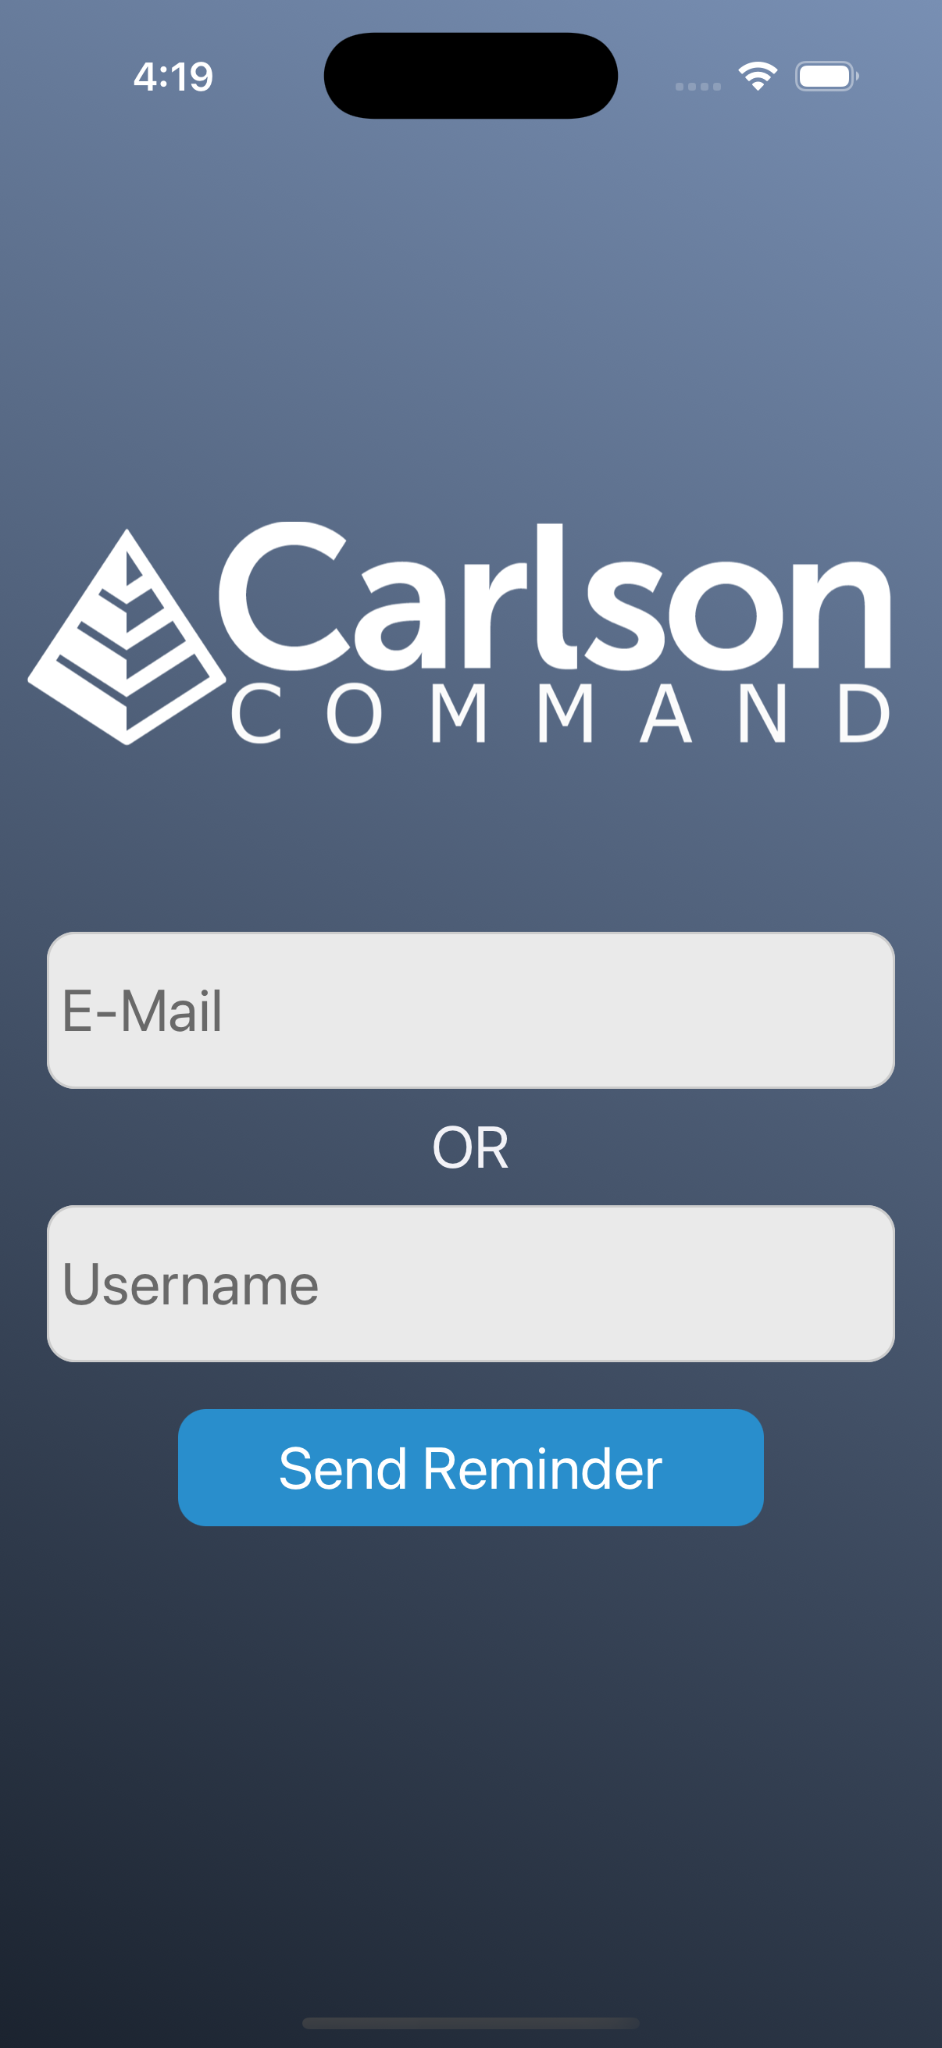
Forgot Password Dialog - Email: Enter the email address associated with the account and a password recovery email will be sent to that address.
- Username: Enter a username and an email will be sent to the email address associated with that account.
- Send Reminder: Tapping this will initiate an attempt to send a password reminder email.
- If successful, a message will be shown indicating a reminder has been sent.

Reminder Succeeded - If unsuccessful, a prompt to retry the request is shown.
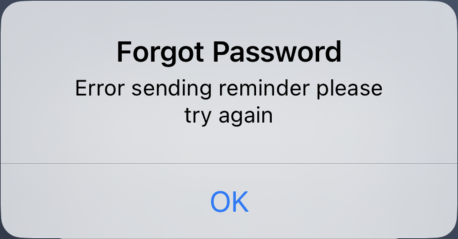
Reminder Failed
Note: To navigate back to the login screen, use the back soft key (Android) or swipe from the left side of the screen (iOS).
- If successful, a message will be shown indicating a reminder has been sent.
- Version Code: Version of app currently installed.
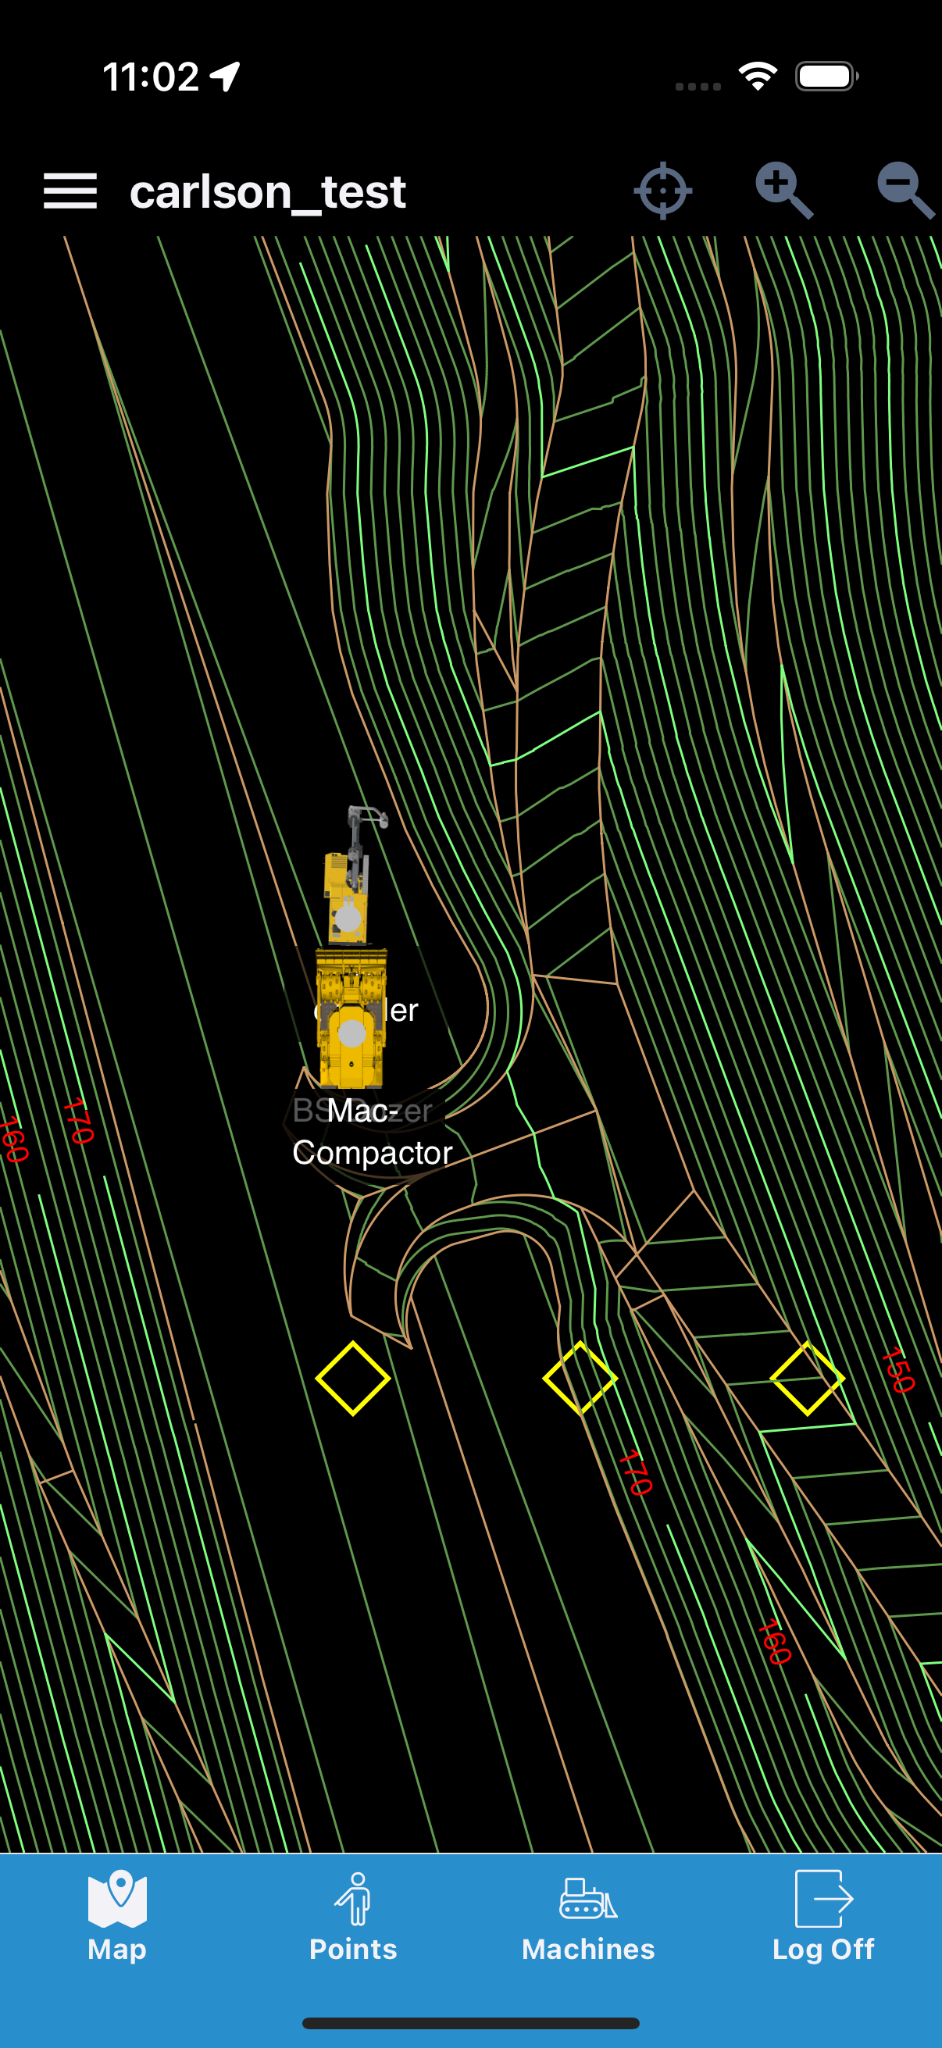
Home Screen (Map View)
After successful authentication, either the Map View is shown or a site specific dashboard (if available). The Map View provides a bird's-eye view of the machines on the site. A default project can be configured to be displayed on startup.
A dashboard view will display, at a glance, metrics to give a graphical overview of site performance.
| Button | Action |
|---|---|
 |
Tapping this 'hamburger' icon will display the Side Menu. |
 |
The name of the currently selected site is displayed at the top of the Map View. |
 |
Tapping the crosshair button re-centers the Map View.
Note: If the position is currently on the site, the crosshair will center the view on the user's position. Otherwise, it will center the view so all machines are visible. |
 |
Tapping the plus magnifying glass will zoom the Map View in. The pinch out gesture (pinch - expand) is also supported for zooming in. |
 |
Tapping the minus magnifying glass will zoom the Map View out. The pinch in gesture (pinch - collapse) is also supported for zooming out. |
Side Menu Reference

| Button | Action |
|---|---|
 |
Navigates to the site Dashboard (displayed only if the site has a dashboard). |
 |
Returns to the Home View. |
 |
Navigates to the Project Loader. |
 |
Navigates to the Cut/Fill Loader. |
 |
Navigates to the Map Drawing Loader. |
 |
Navigates to the Change Site screen. |
 |
Navigates to the File Upload screen. |
 |
Navigates to the Settings screen. |
 |
Navigates to the Machine Alerts screen. |
 |
Navigates to the Drill Hole Select screen (if available). |
 |
Navigates to the Pile Select screen (if available). |
Bottom Buttons
| Button | Action |
|---|---|
 |
The Map button goes to the Map View. |
 |
The Points button goes to the Point List for the site. |
 |
The Machines button goes to the Machine List. |
 |
The Log Off button will log the user out of the app and return to the Login screen. |
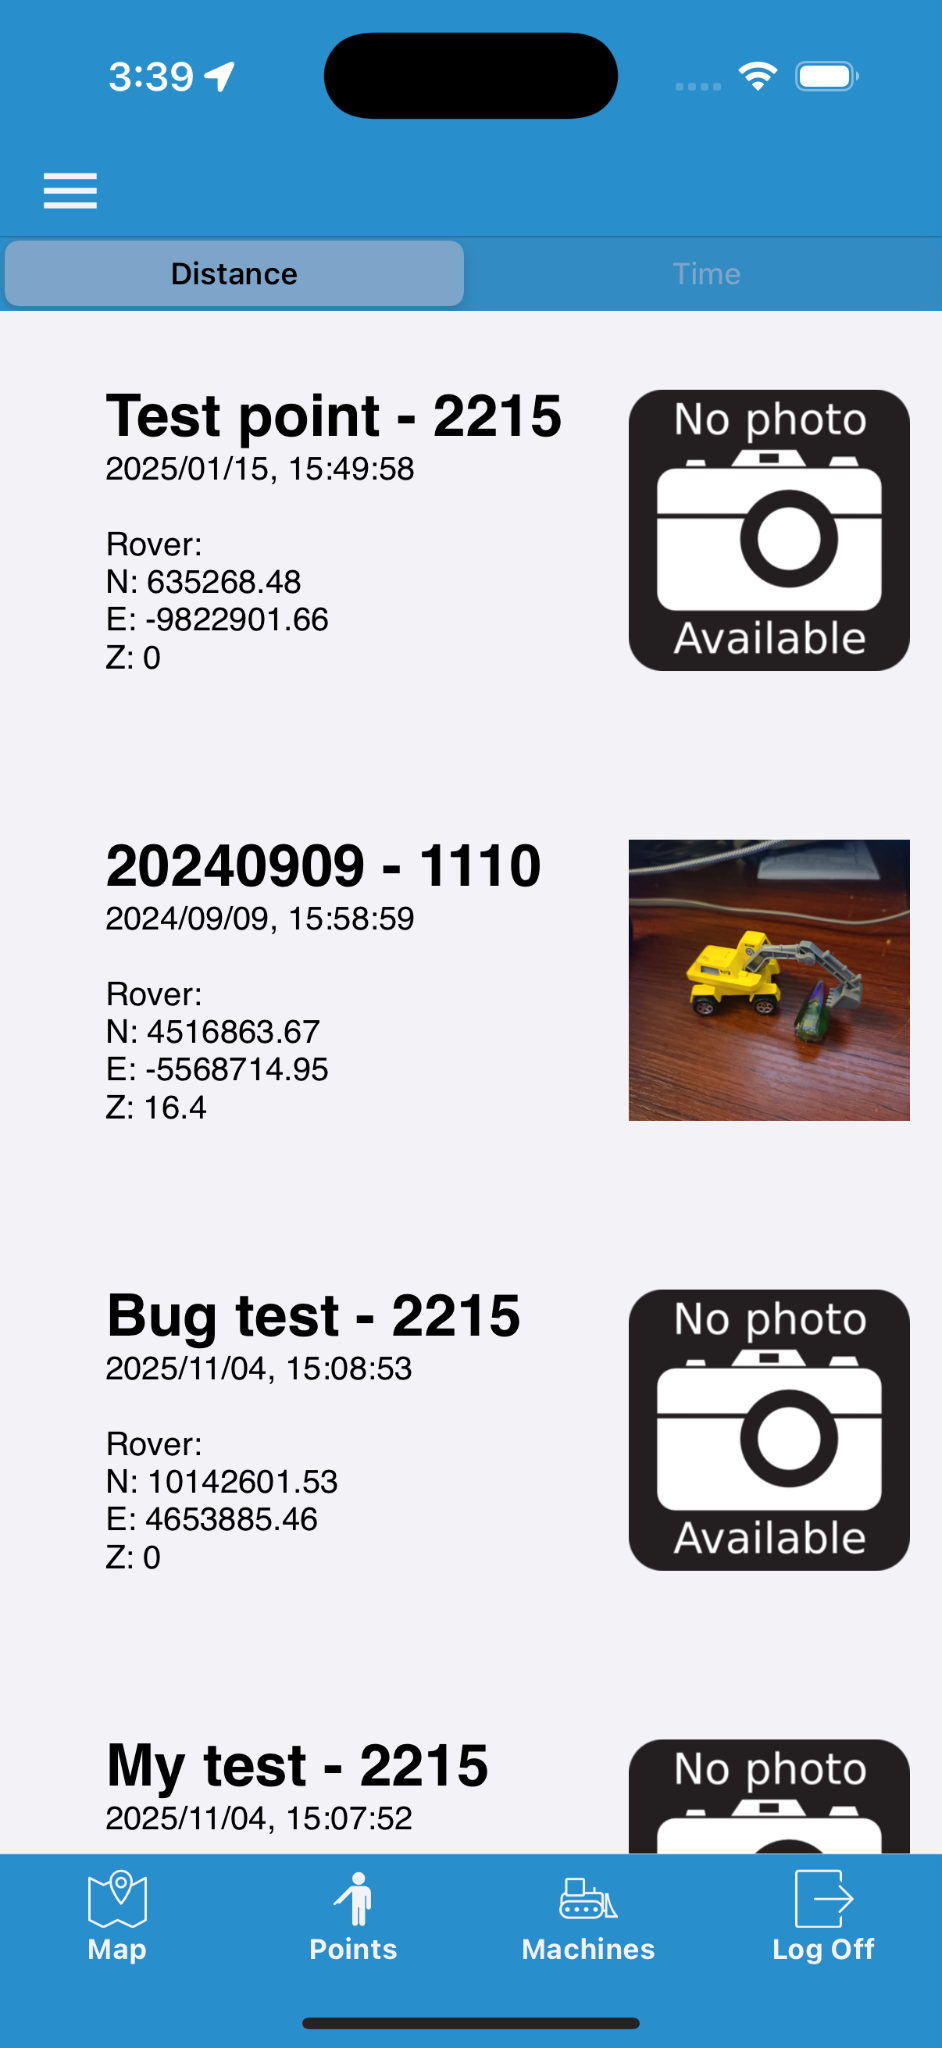
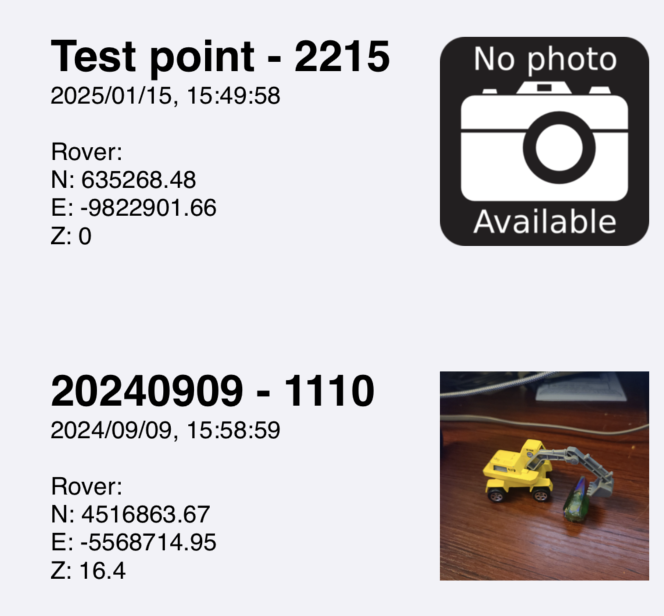
Points Screen
The Points screen shows a list of Grade Manual Points (GPTs) as well as Low Precision Points (LPTs), both of which are used to highlight specific locations of interest on a site. Additionally, add or change the picture associated with the GPT or LPT points to provide further information about the point(s).
Note: Add LPT from this screen using the on-board location of your mobile device.
Note: Points, along with their pictures, can also be viewed in Command Desktop using the Grade Manual Point Report.
Points Screen Interface Reference
| Aspect | Description |
|---|---|
 |
Toggle between displaying the 15 closest or 15 most recent points. |
 |
The Add Point button is at the top of the list and will display the Add Point dialog. |
 |
|
More Point Details
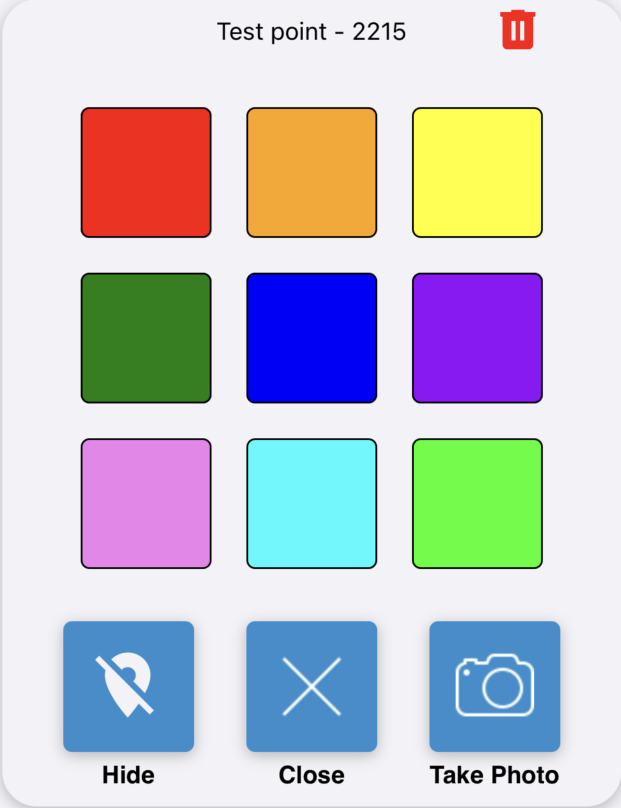
Point Options Reference
Tapping a colored square will color the point on the map.
| Option | Descriptions |
|---|---|
 |
Removes the selected color and removes the point from the map display. |
 |
Closes the point options modal dialog box. |
 |
Navigates to the Camera Preview screen for the selected point. |
 |
Deletes point after confirming. |
Add Point Reference
When adding a point from Command Mobile, the point will use the relatively low-precision GNSS (GPS) position from your mobile device. These points are designated LPTs to distinguish them from the higher-precision Grade Points (GPTs that would be made using a high-precision GNSS device).
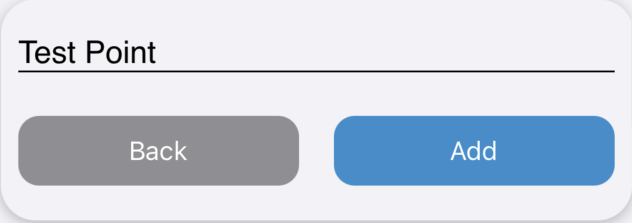
- Name: Enter the name for the new point.
- Back: Cancels the Add Point.
- Add: Adds the new point to the point list.
Note: This makes LPTs well-suited for use cases that prioritize fast, approximate location identification over high-precision positioning.
Point Camera Reference
Pictures can be attached to points to further convey information related to the point.
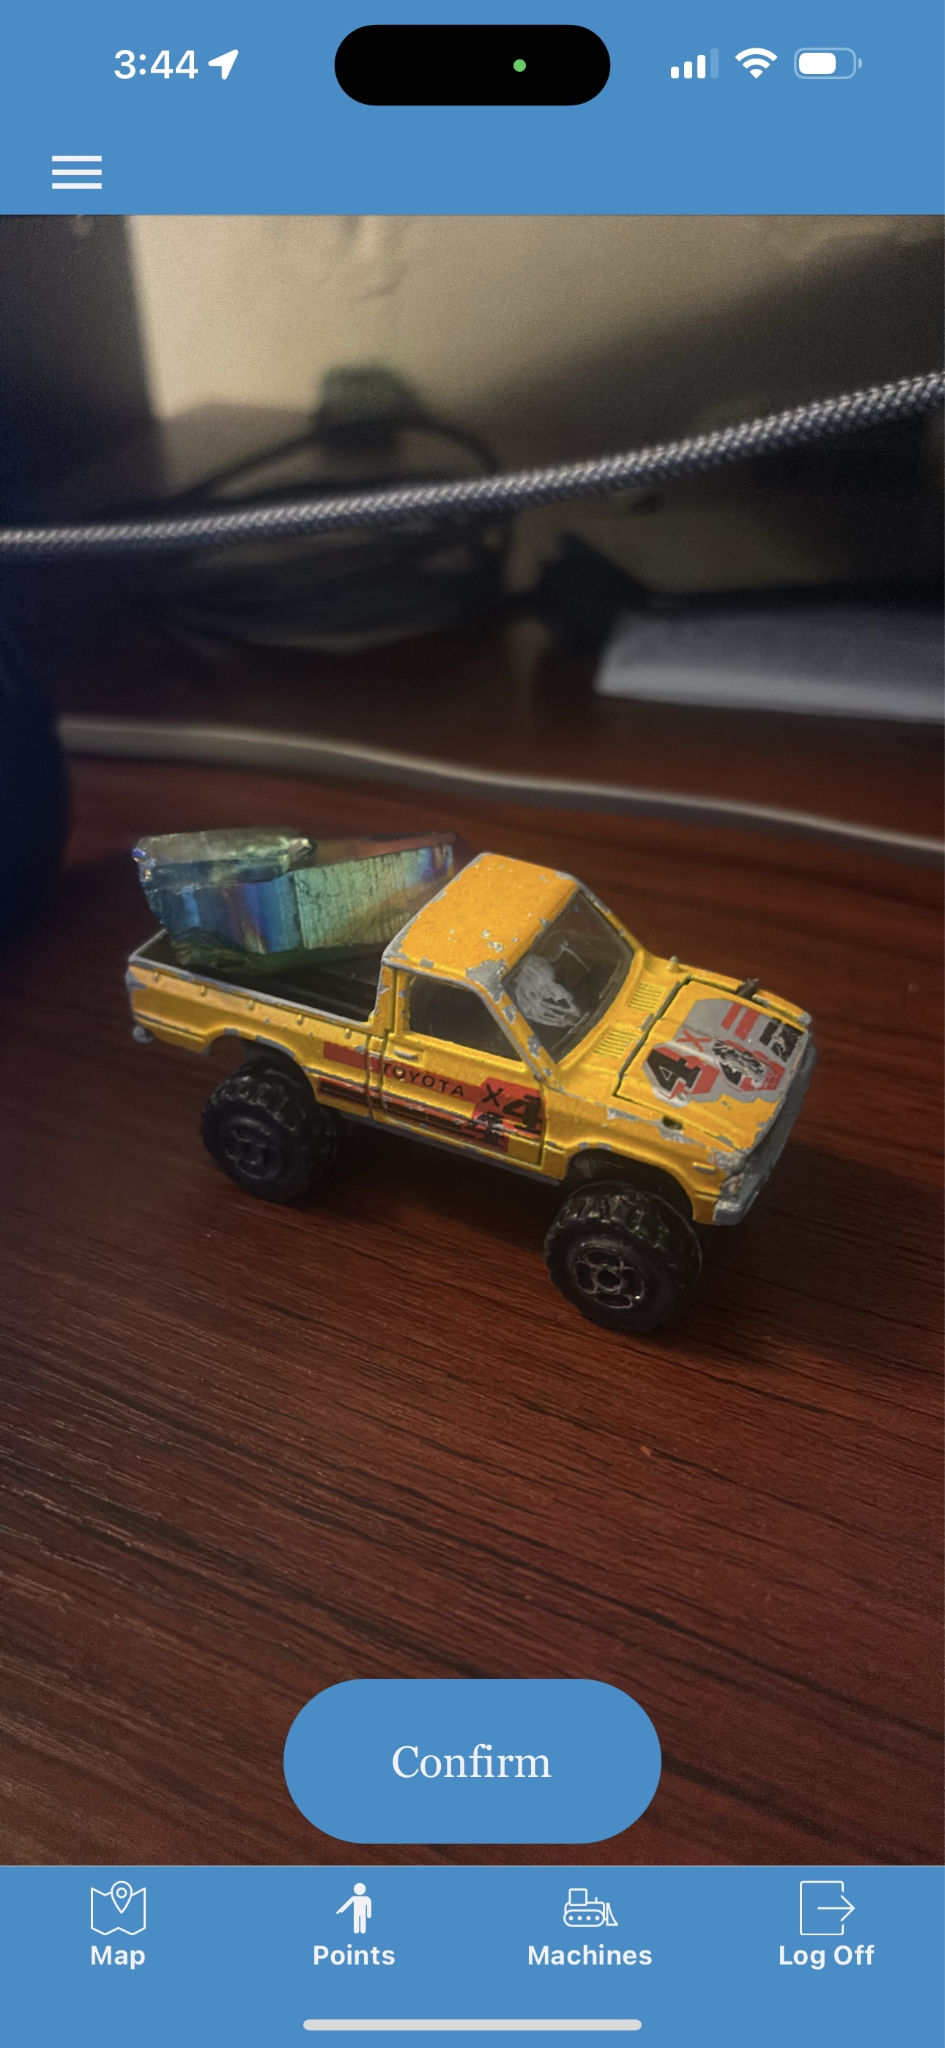
| Preview Mode | Confirm Mode |
|---|---|
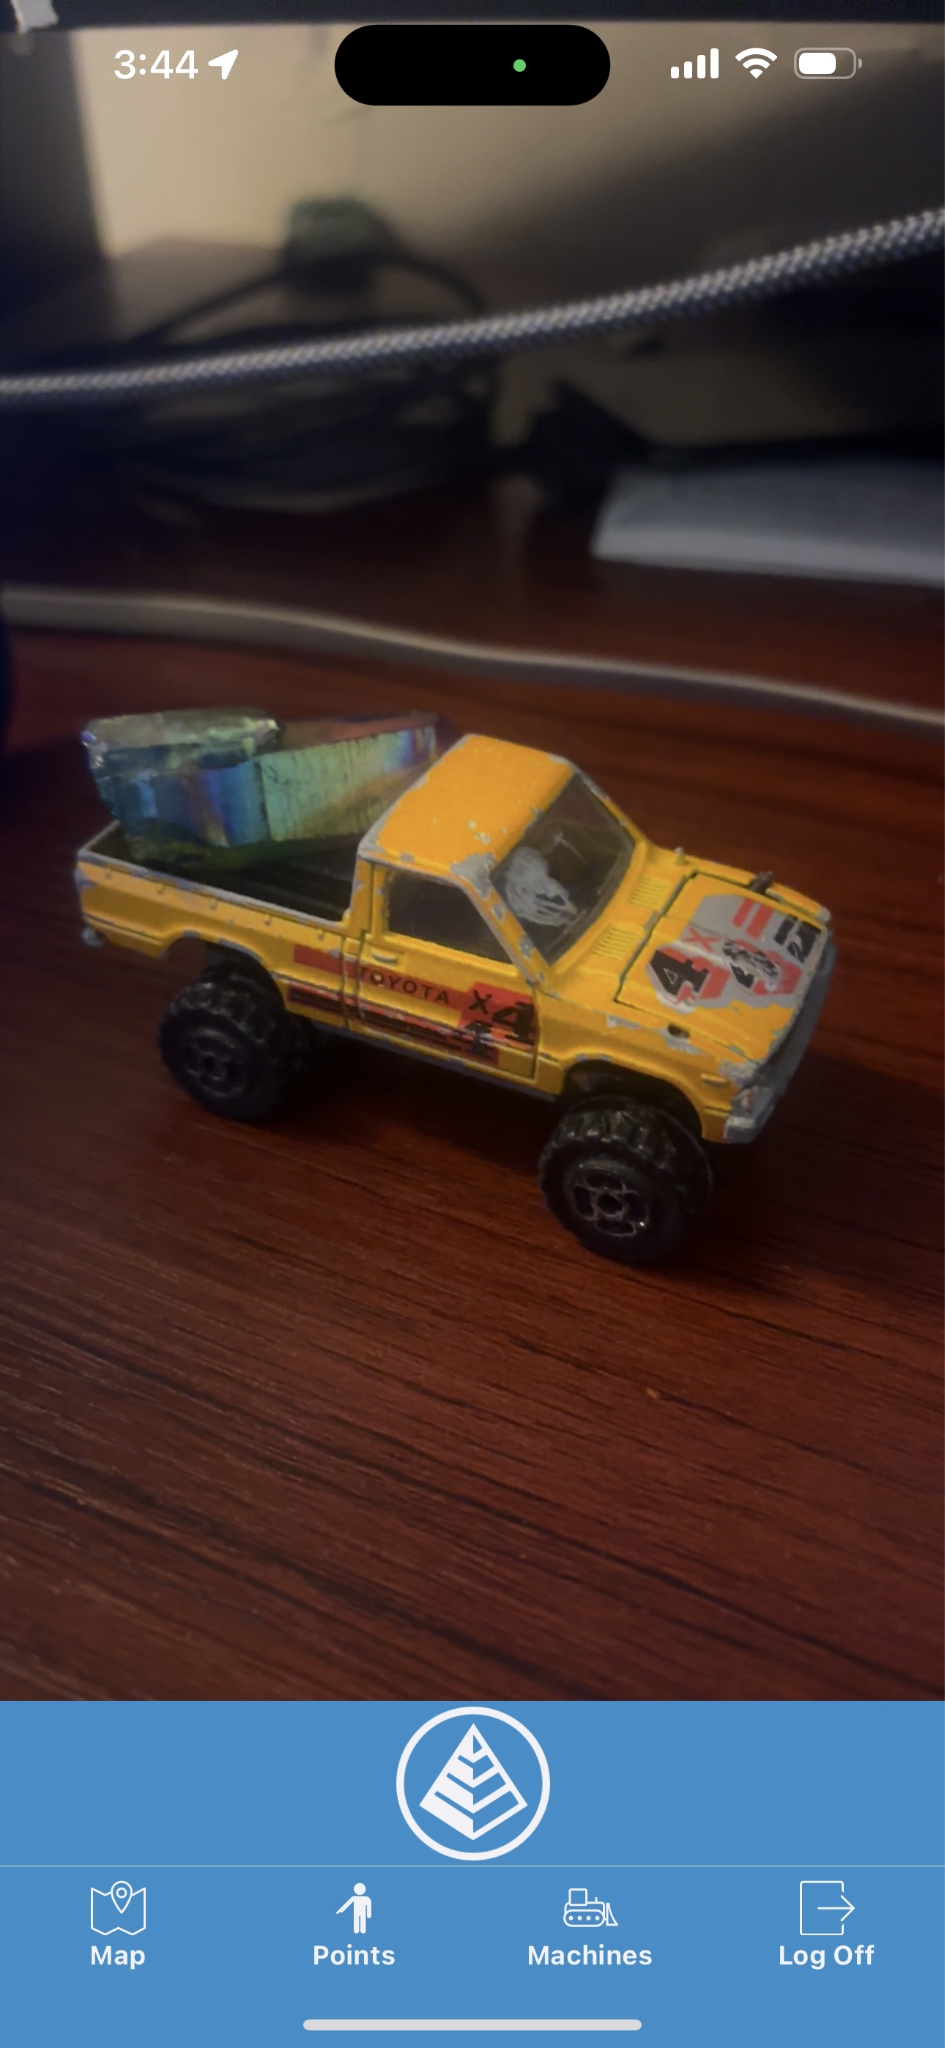
|
|
|
Tapping the Carlson shutter button will take a picture and navigate to the Photo Confirmation screen.
|
You can confirm the photo is correct. Tapping the Confirm button will add the photo to the point and navigate to the Point list.
|
Machine List Screen
The Machine List shows an overview of all machines on the site. Select a machine to view additional details. Additionally, add a Machine using the button at the bottom of the Machine list.
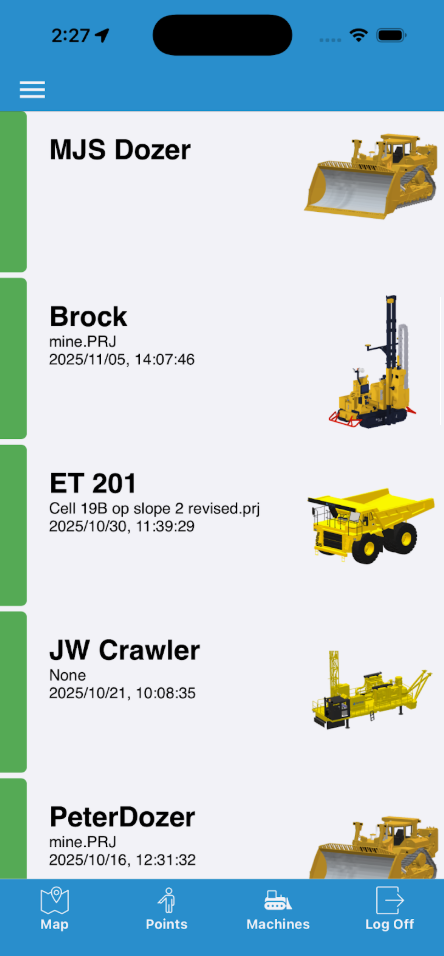
- Each Machine is represented by an item in the list and displays:
- the machine name
- alert information (if available)
- a summary of the machine status
- Tapping an item in the list navigates to the Details screen for that Machine.
- The colored bar on the left of the Machine List item indicates the Status (health) of the machine(s).
More Information
Machine Status Reference
Machine Status Indicators Indicator Status 
Indicates that the machine has an operational error. 
Indicates that the data streaming-in is ahead of the server time. This means the clock in the machine is wrong and should be fixed immediately. This usually occurs when the system clock in the machine gets a bad date from the GPS. 
Indicates the machine with the wrong hardware ID is attempting to stream-in but is locked-out. A machine with the correct hardware ID is not currently streaming. 
Indicates that the machine was communicating but has recently stopped. If a connection is not established within 15 seconds, the icon will turn red. 
Indicates that the data coming in is older than the server time. This can happen if the machine was offline and is now catching up, or if the clock on the machine is behind the server clock. 
Indicates two machines are streaming-in as the same machine name. One machine's hardware ID matches the database for the machine and the other does not. 
Indicates that the machine is communicating with the office, and is functioning properly. 
Indicates that the machine has been placed in a down state. 
Indicates that the machine is not communicating with the office. - The Image on the right of the Machine List item indicates the type of machine.
- Tapping the Add Machine button at the bottom of the list navigates to the Add Machine screen:

Add Machine Button
Note: The Machine List updates every 10 seconds.
Add Documnent
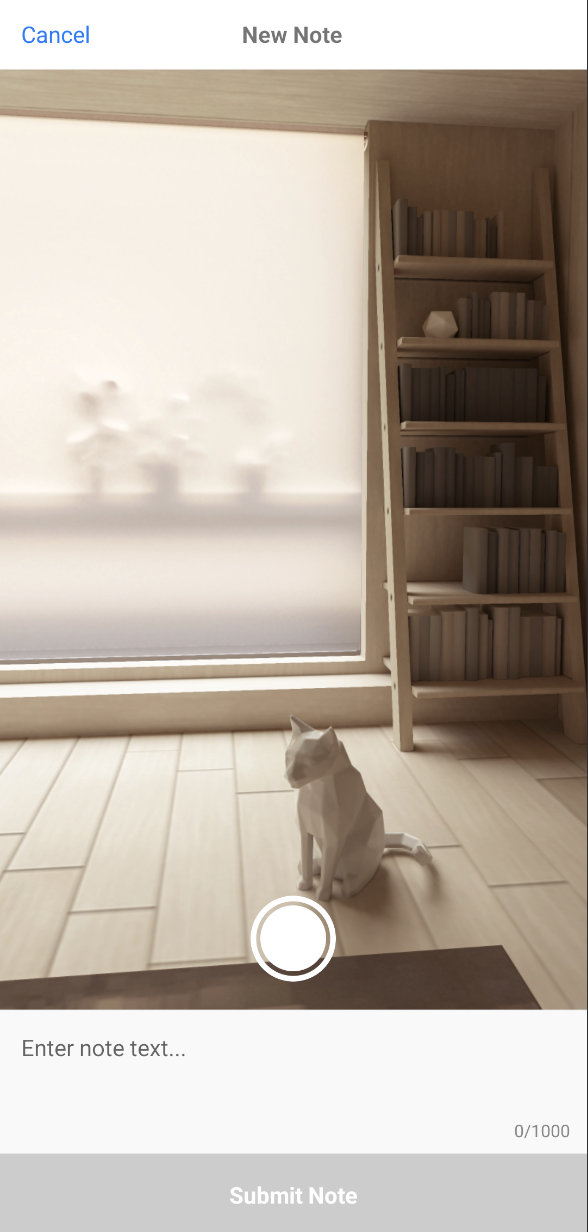
- Tapping the shutter button will take a picture that will be submitted with the note.
- Text can be entered and will be submitted with the note.
- Tapping the retake button will remove the picture and allow you to take another.
- Tapping submit will submit the note. A note must contain text, image, or both.
Add Machine
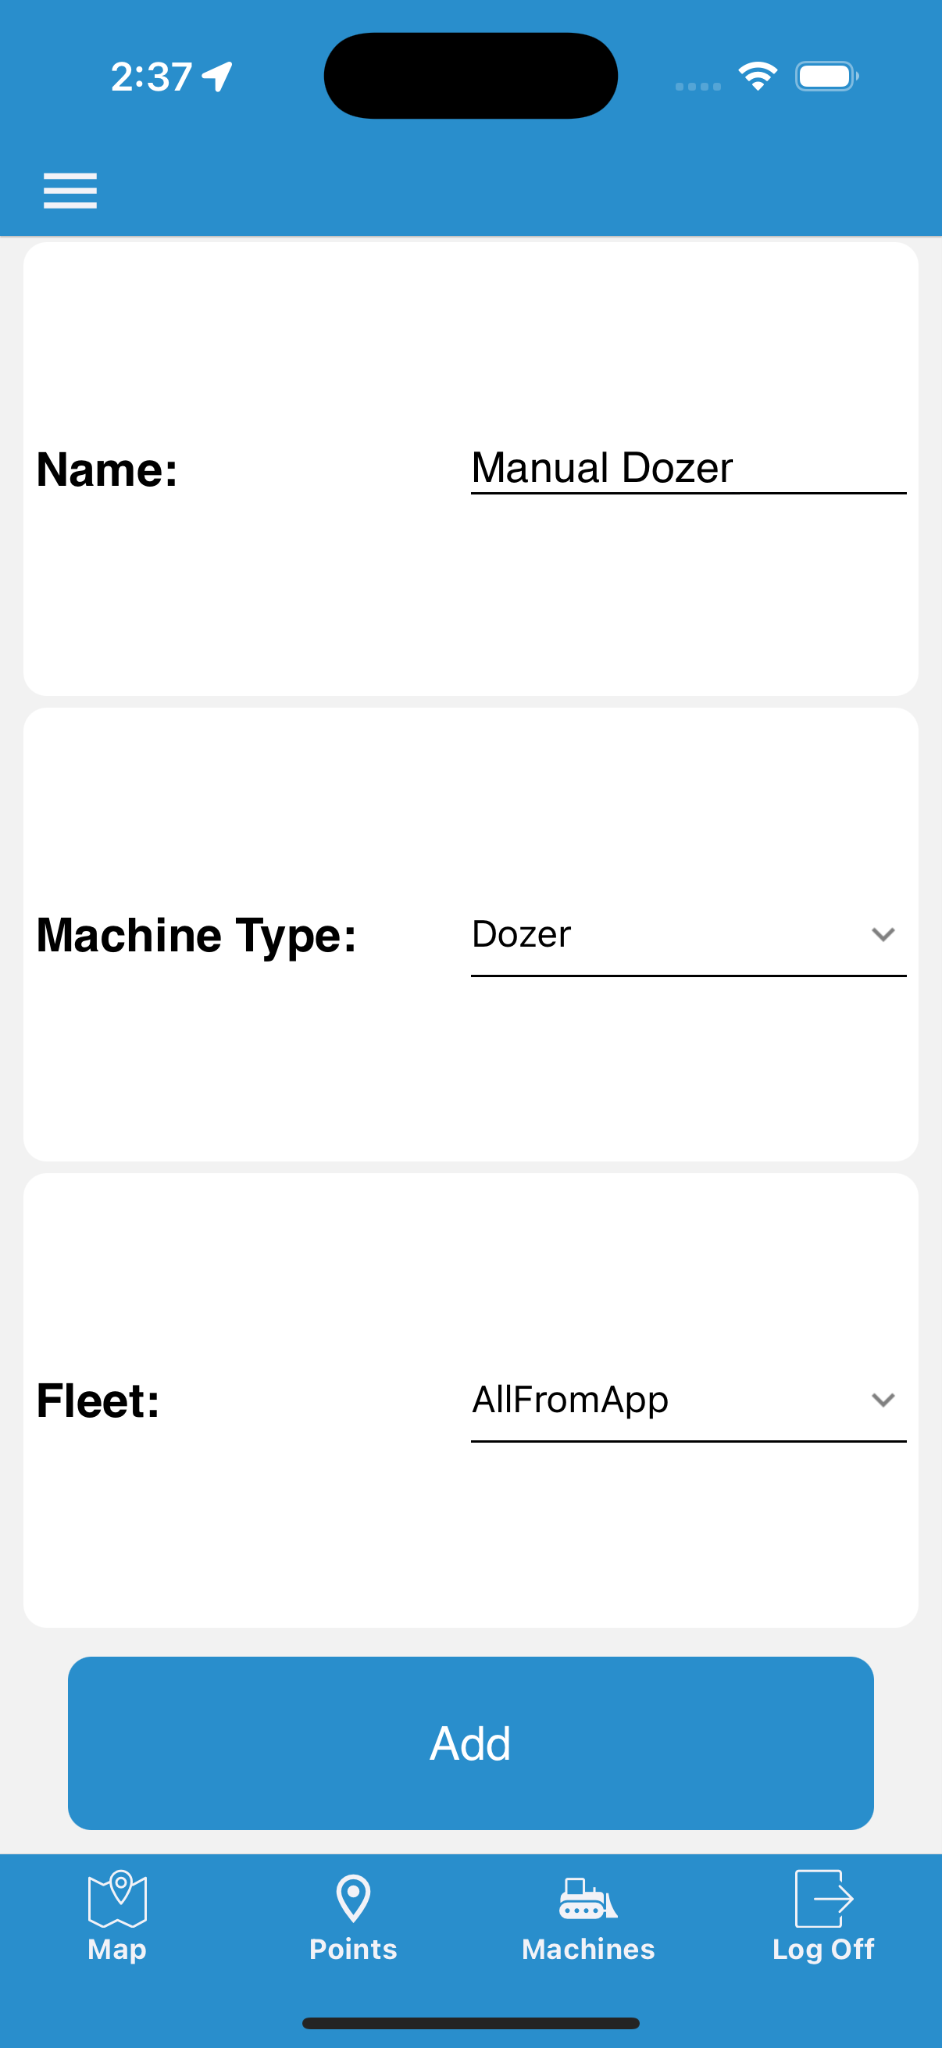
- Enter a Machine Name.
- Select a Machine Type.
- Select a Fleet for the machine.
To cancel:
- iOS: Swipe from left to right to go back.
- Android: Tap android back button to go back.
Note: Tapping Add creates the machine in the selected Fleet and navigates to the Edit Screen.
Note: After adding a machine, a Surface Update Type is selected based on the Machine Type.
Edit Machine
The Edit Machine screen allows changes to the selected machine.
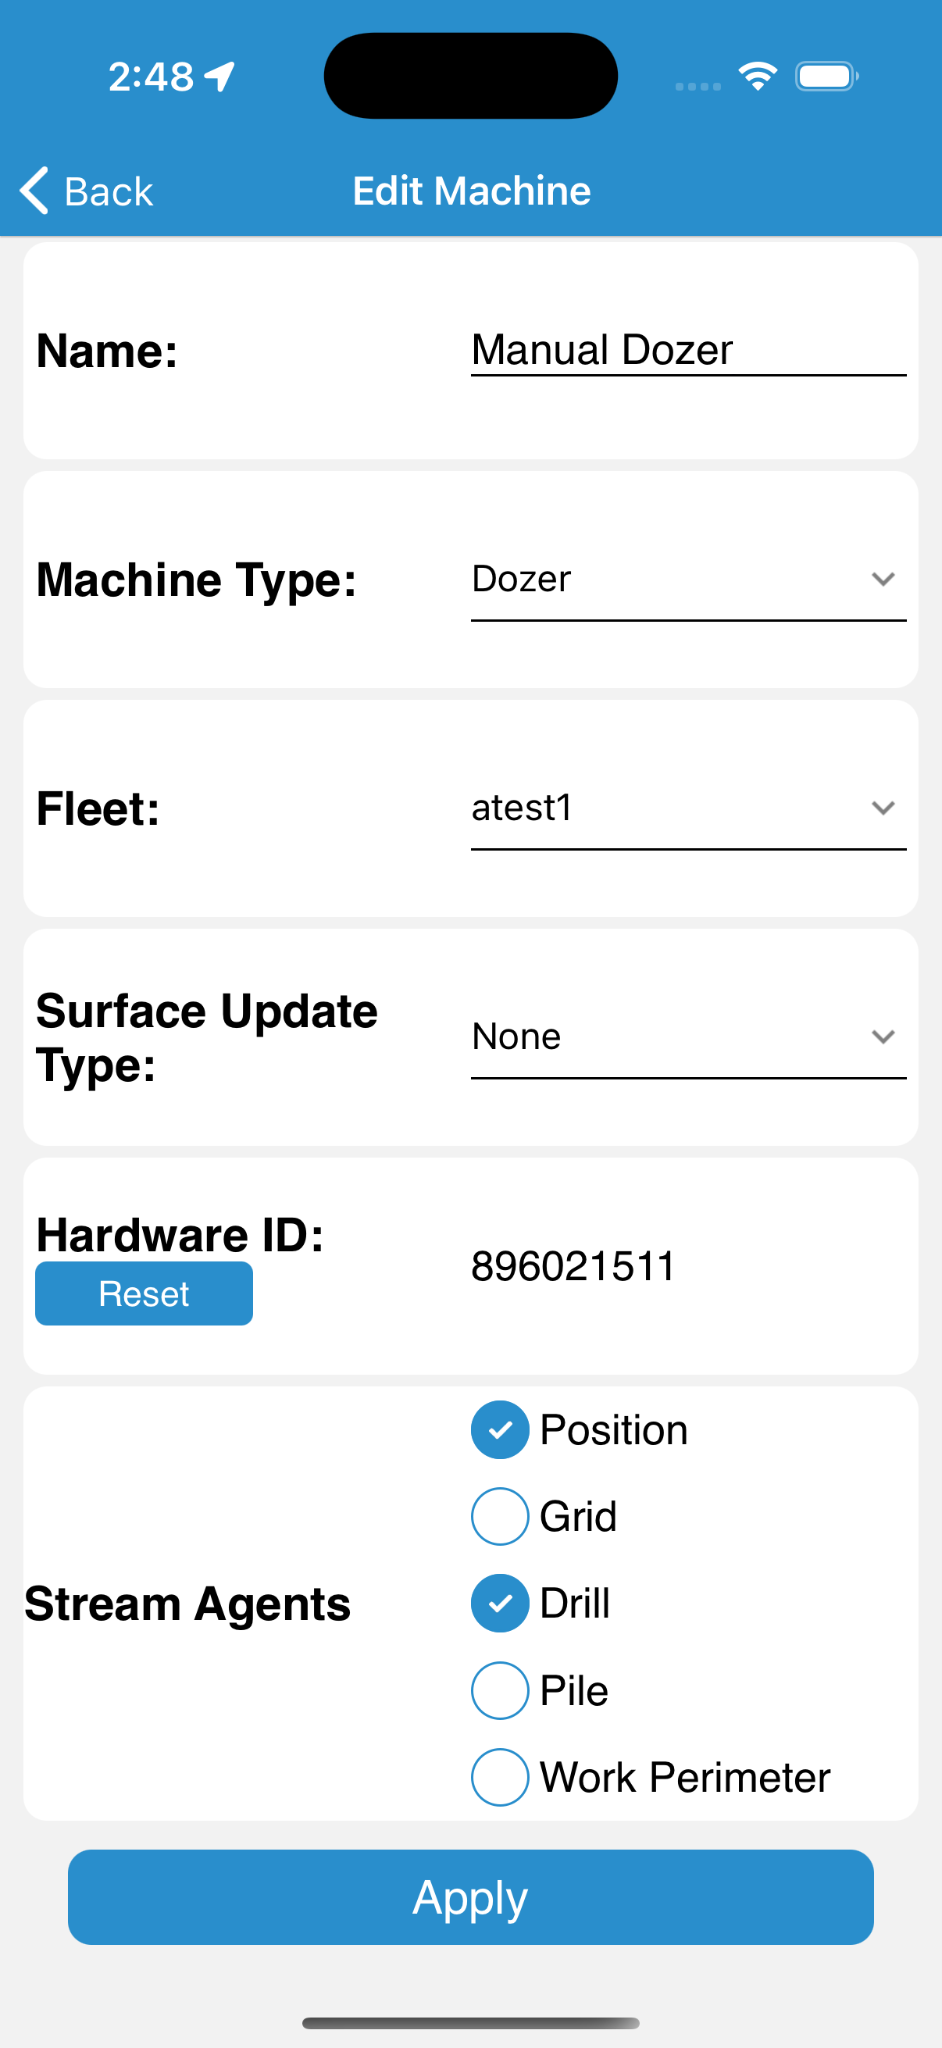
- Name: The display name of the selected machine.
- Machine Type: Set the machine type from the list of available machine types.
- Fleet: Set the fleet that the machine belongs to by selecting from the list of available fleets configured in Command.
- Surface Update Type: Selects surface update type from the list of available surface update types.
- Hardware ID: The unique hardware ID of the machine.
Note: This value cannot be edited, it can only be reset.
- Stream Agents: Select the stream agents the machine should use.
- Apply: Applies changes made to the machine.
Note: Changes are not saved until the Apply button is tapped and the confirmation window is confirmed.
To cancel:
- iOS: Swipe from left to right to go back.
- Android: Tap android back button to go back.
Machine Details
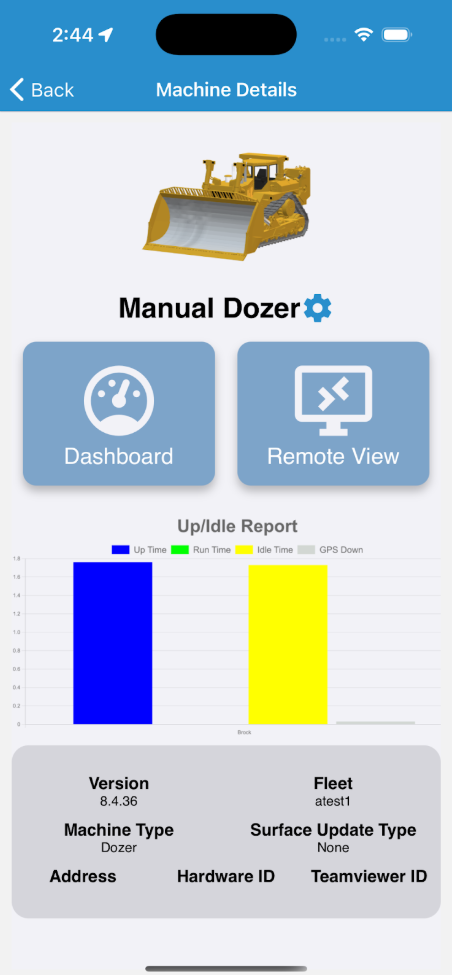
- Edit Machine: Navigates to the Edit Machine screen.
- Add Doc: Displays the add document modal.
- Zoom to Centers the map view on the selected machine.
- Dashboard: Tapping the Dashboard button navigates to the Machine Dashboard.
- Remote View: Tapping the Remote View button navigates to a remote view of the machine grade instance.
Note: If the machine is online and available, the Remote View shows the same screen view that the operator sees.
- Up/idle Report: Provides an at-a-glance overview of the machine status within the past 24 hour period.
- Version: The Version of Grade the machine is running.
- Fleet: The fleet this machine is part of.
- Machine Type: The vehicle type of the selected machine.
- Surface Update Type: Indicates surface update method(cut, cut/fill, none).
- Address: Local network address of the machine.
- Hardware ID: Unique ID.
- Team viewer ID: Machine ID for Team Viewer remote view.
- Documents: shows/hides the list of documents for the selected machine
Machine Dashboard
Metrics are displayed in site units and measured over the past 12 hours.
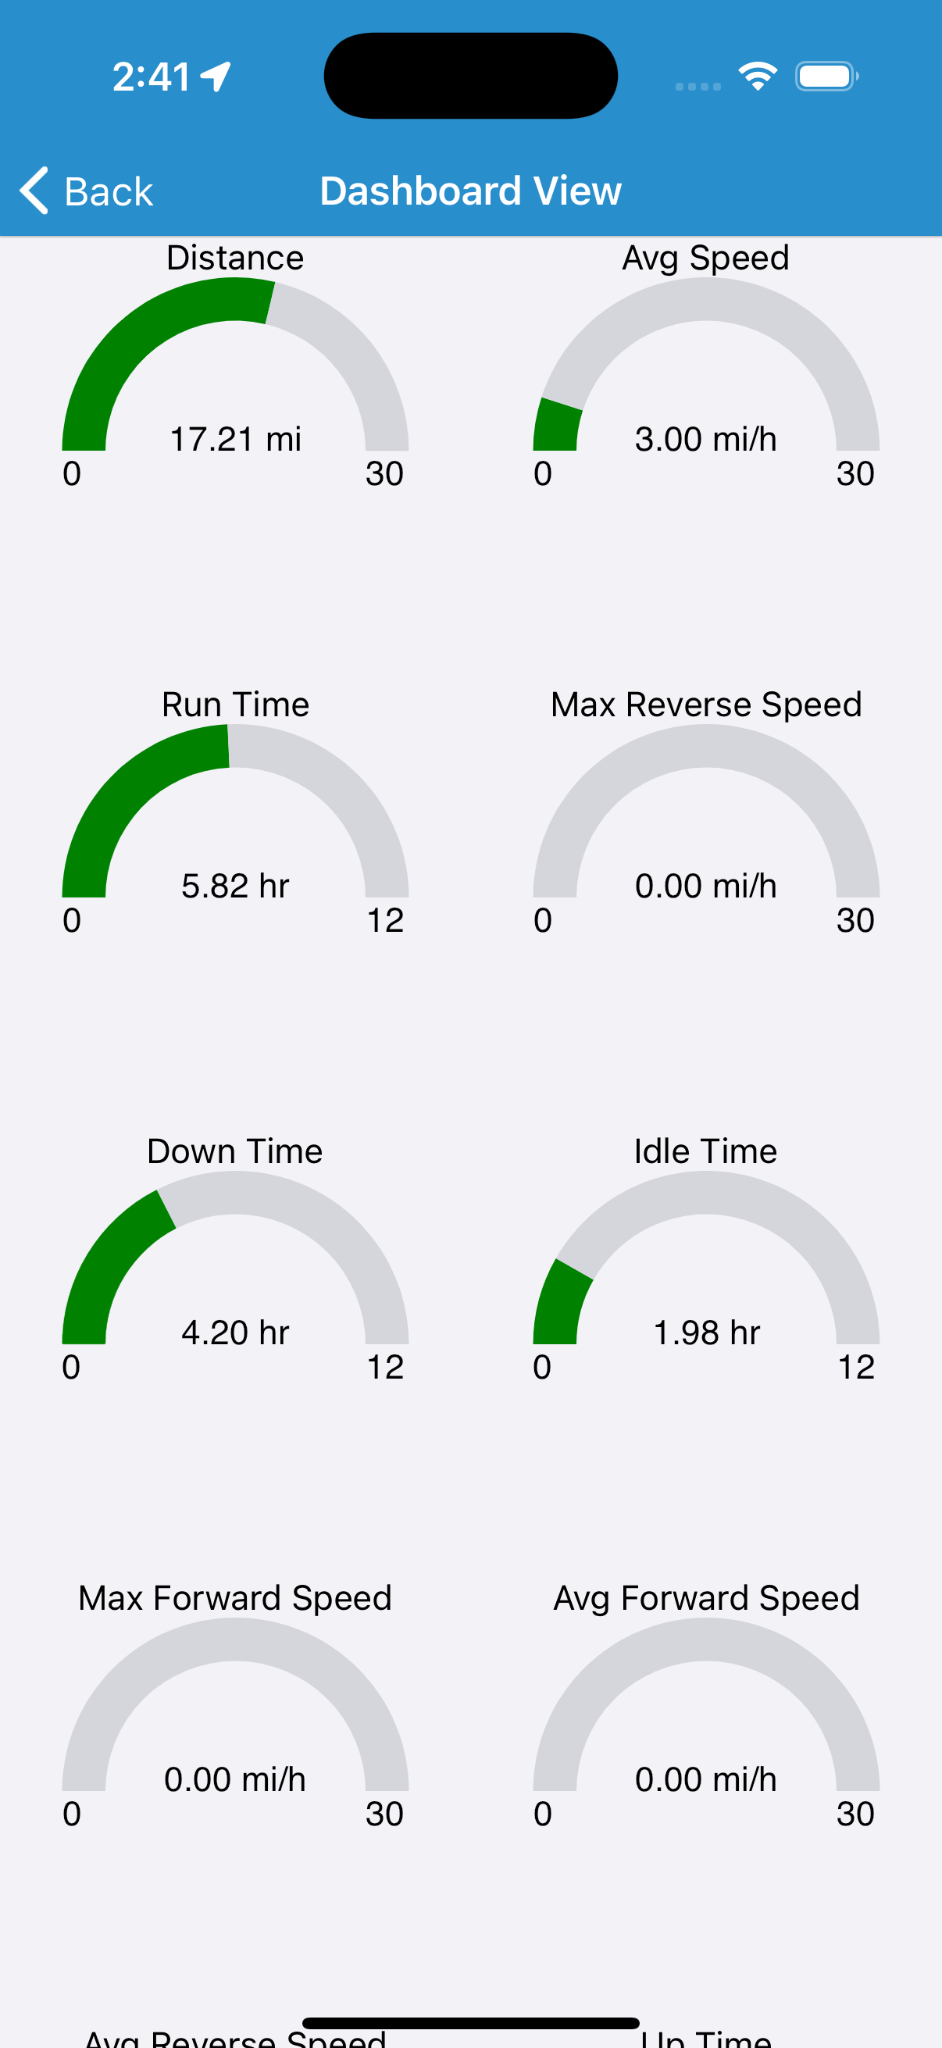
- Distance: Distance machine has travelled.
- Avg Speed: Average machine speed.
- Run Time: Time Machine has spent running.
- Max Reverse Speed: Highest speed machine has achieved while moving in reverse.
- Down Time: Amount of time machine has spent in the down state.
- Idle Time: Amount of time machine has spent idling.
- Max Forward Speed: Highest speed machine has achieved while moving forward.
- Avg Speed: Average speed of machine moving forward.
- Avg Reverse Speed: Average speed of machine moving in reverse.
- Up time: Total time machine has been on.
- GPS down: Total time machine GPS has been unavailable.
- Net Fill/Cut: Volume of material machine has Filled/Cut.
Note: The label is changed to keep the number positive.
- Max Speed: The highest speed the machine has achieved in any direction.
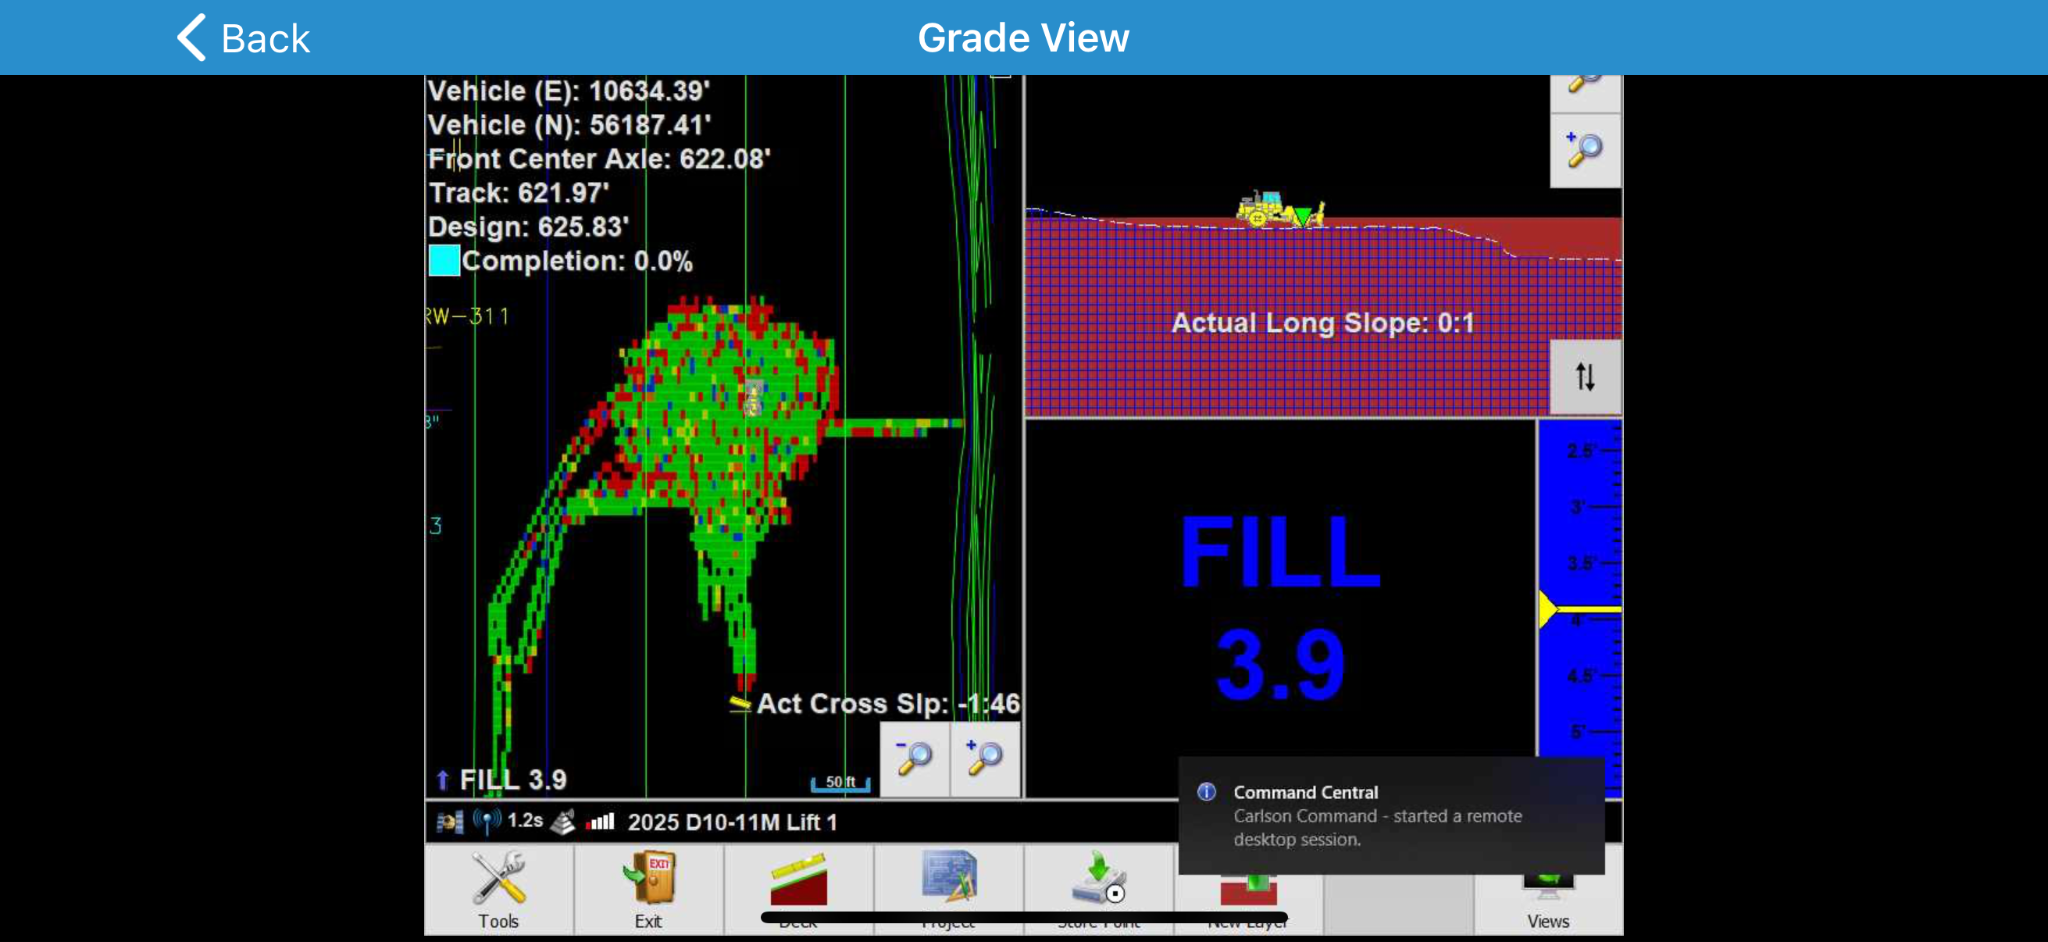
Remote View
The Remote View allows viewing the Grade program for a given machine.
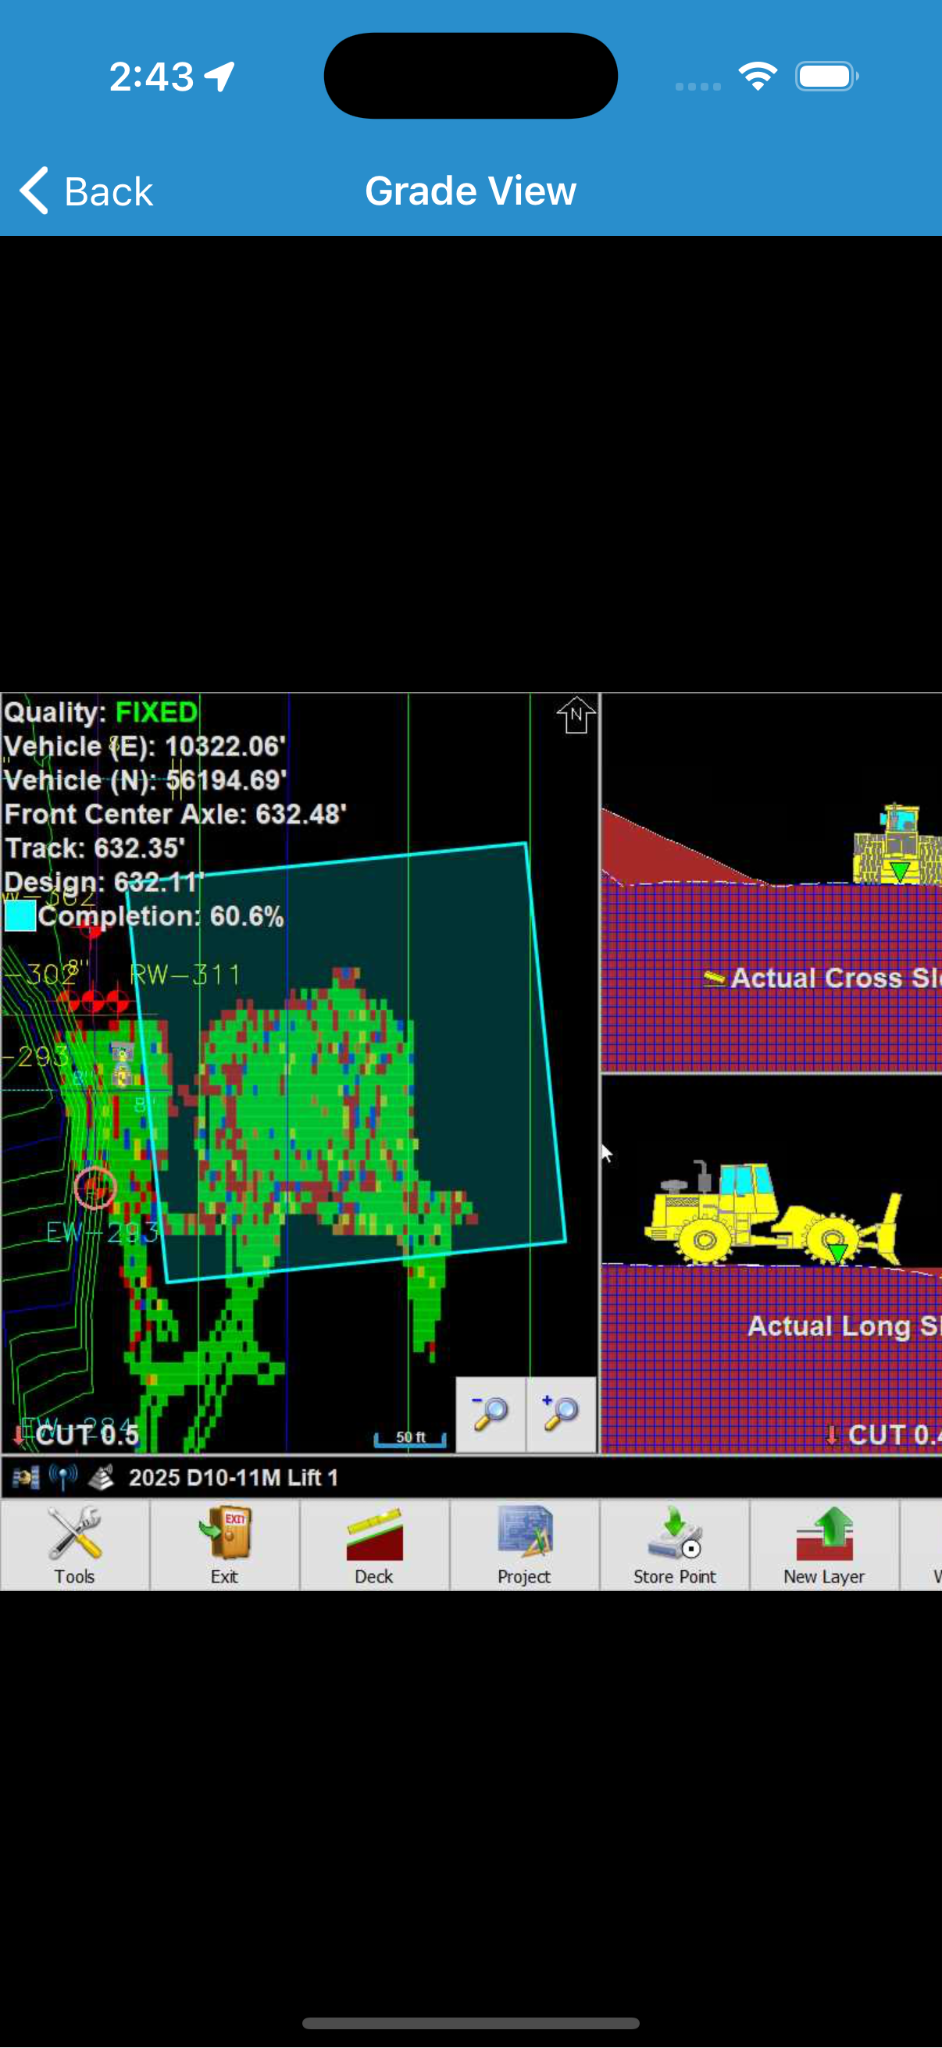
You can interact with the Grade program from this screen.
Note: This is a live view so interactions from Remote View will be reflected on the machine in real-time.
Note: The machine operator is notified that a Remote Session has been started but this notification does not impact their ability to see and interact with their Grade console.
If a machine is powered off or the Grade program is otherwise unreachable, a notification to confirm the machine is powered on and has a network connection is displayed.
Tapping Back in the top left of the screen closes the connection and returns to the Machine Details screen.
Project Loader
From the Project Loader screen, select a project from the list of available projects by tapping the name of the project to load.
Project List Interface Reference
You can further customize the display by choosing the surface type you want to see:
| Option | Description |
|---|---|

|
Use Design surface for Project display. |

|
Use Cut/Fill surface for Project display. |

|
Use Existing surface for Project display. |
The distinction between a project that is selected and one that is not is illustrated below:


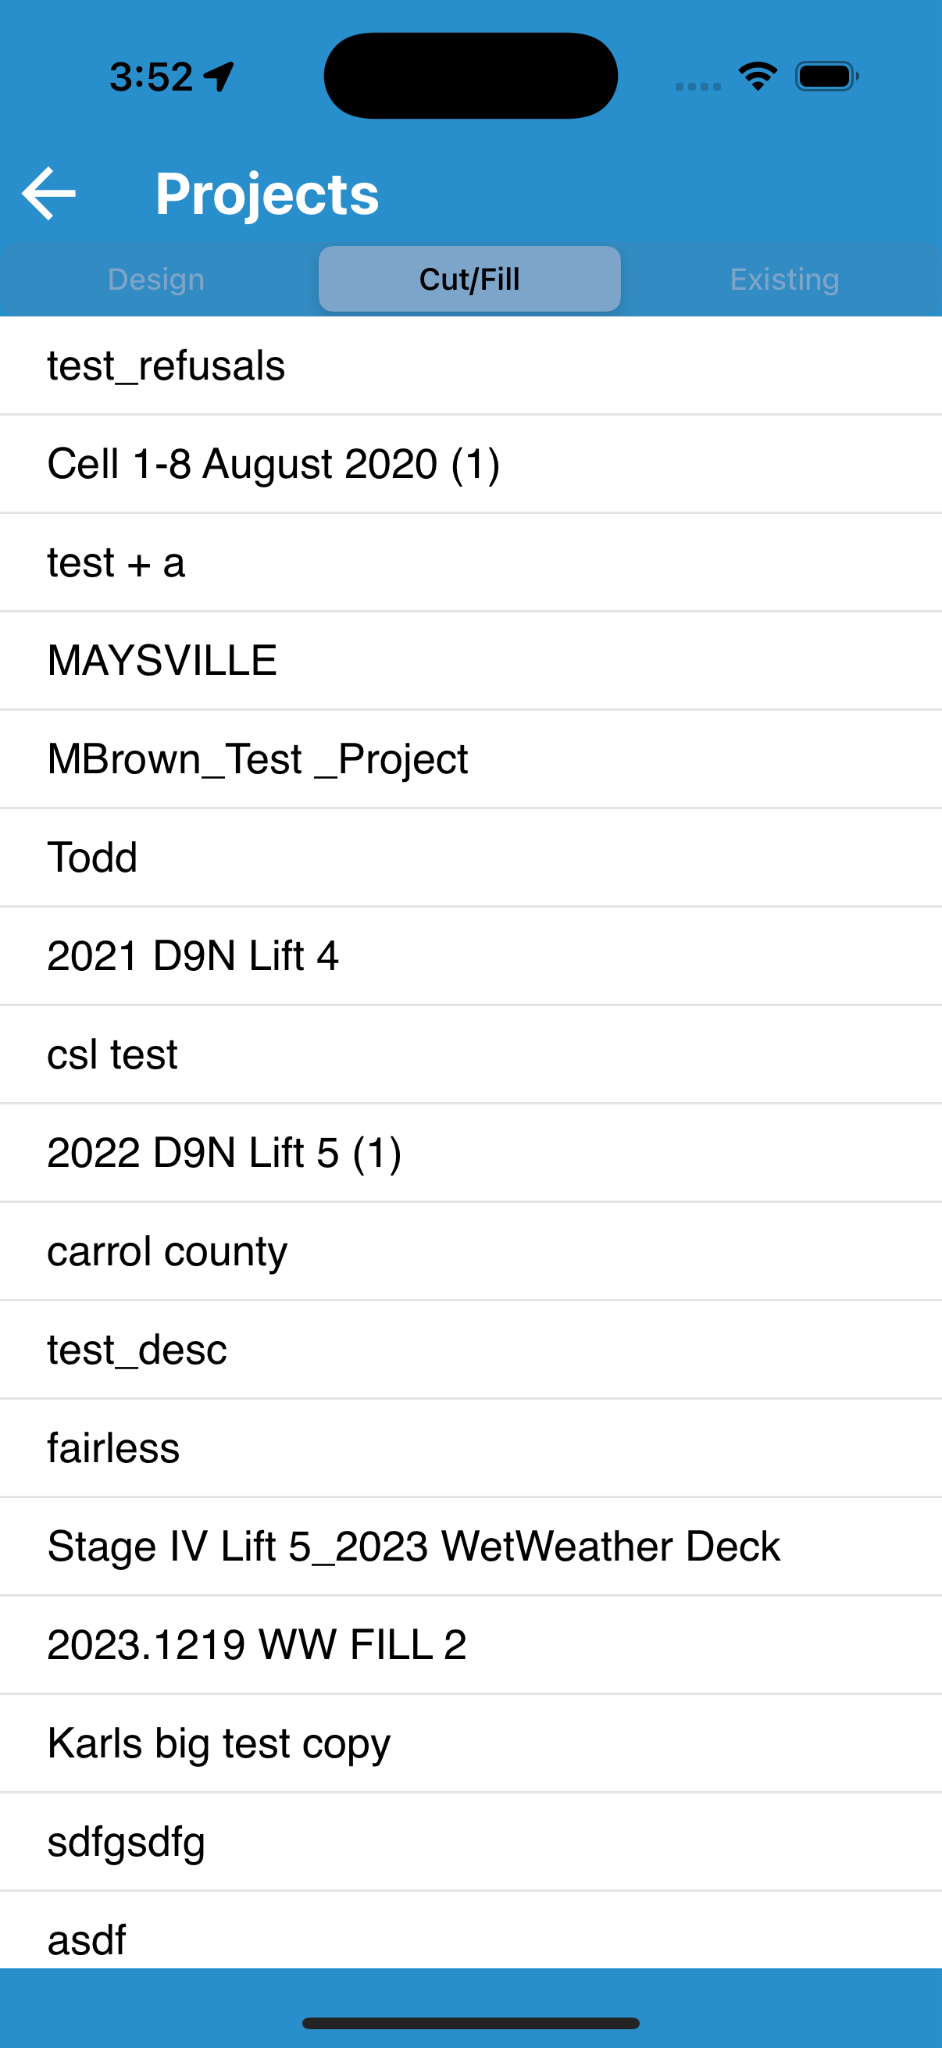
Cut/Fill Loader
From the Cut/Fill Loader, you can select an initial grid and a design grid to see the elevation differences on the map.
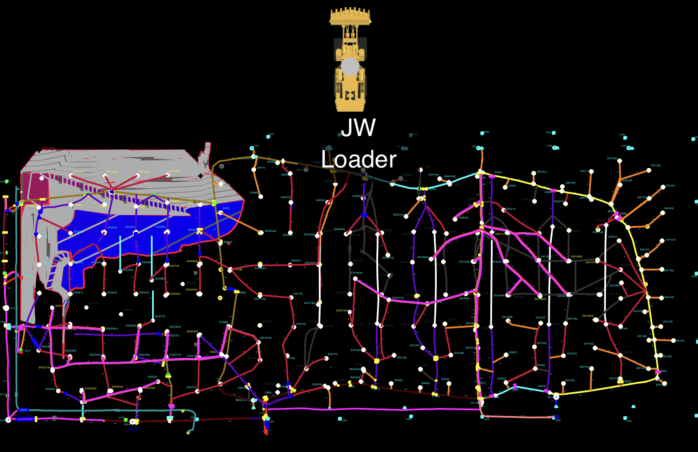
- When first navigating to the Cut/Fill screen, no items will be selected and the Apply button will be disabled:
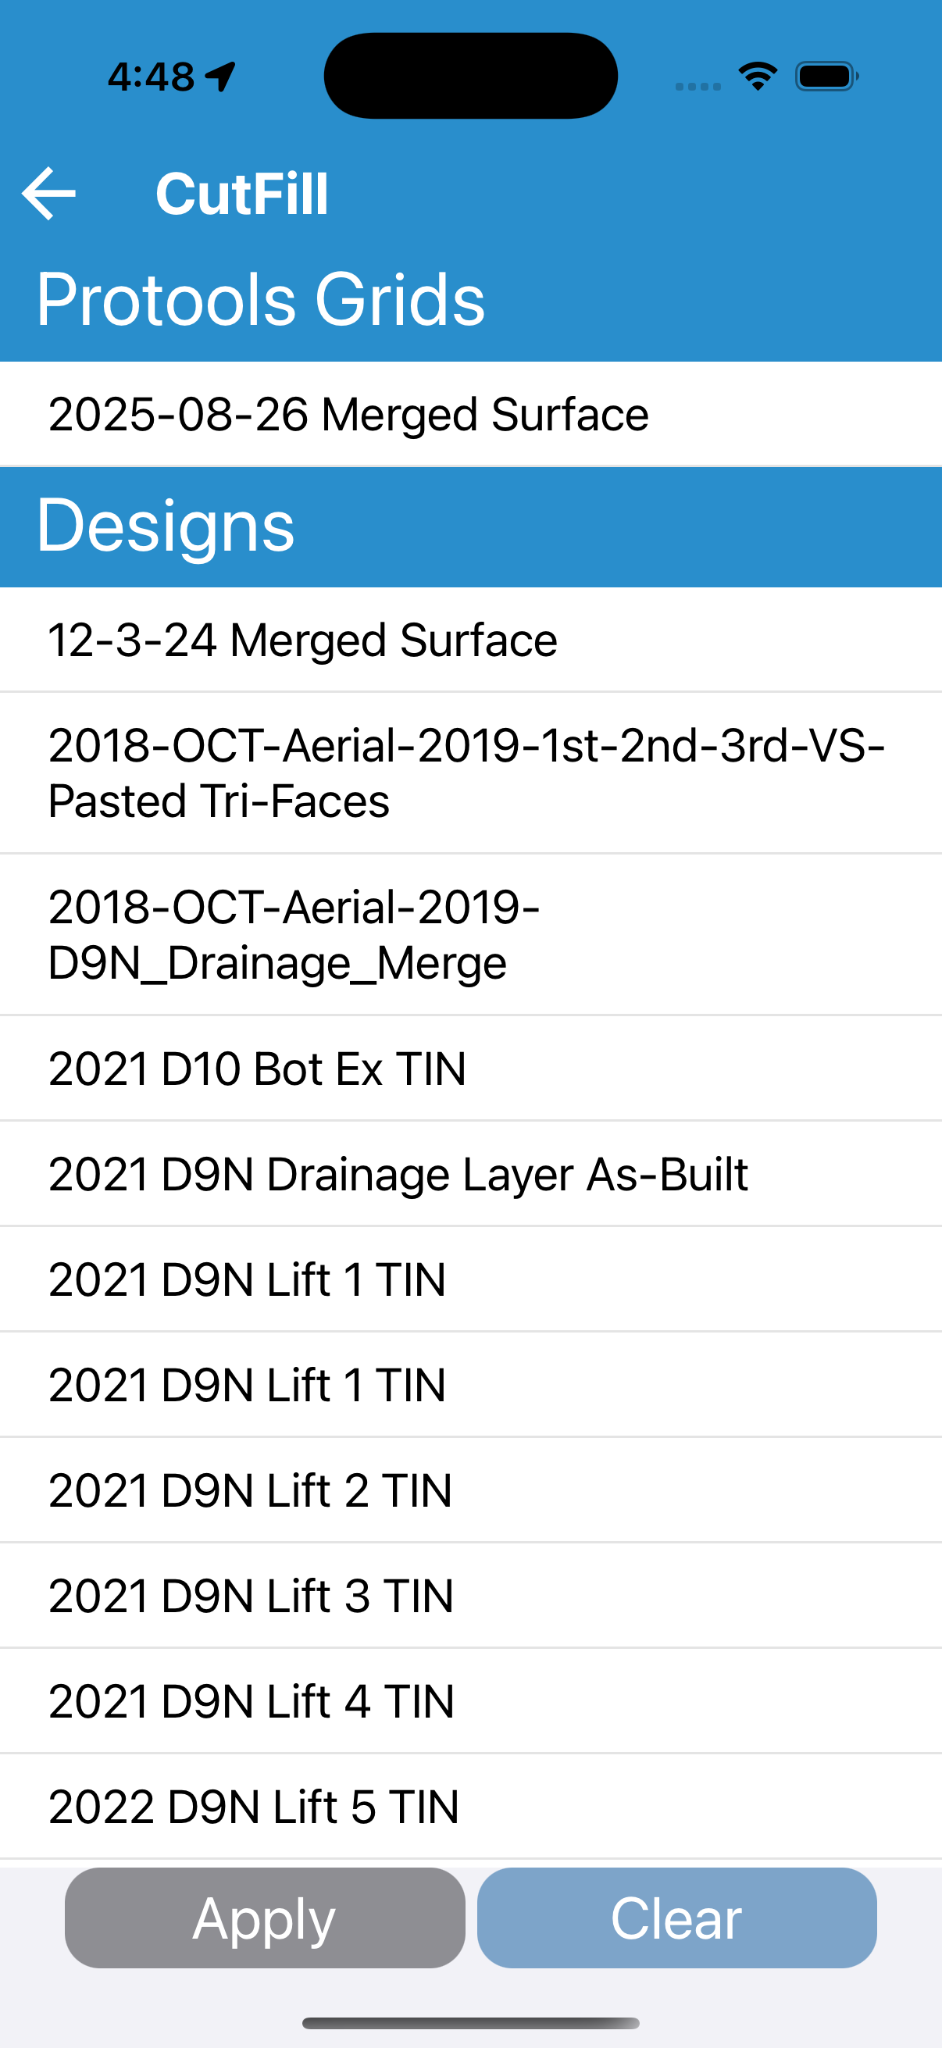
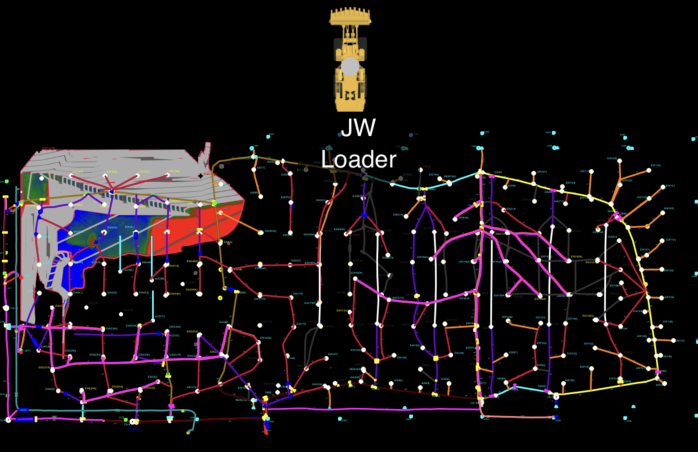
Initial View - Nothing Selected, Apply disabled - Select an initial existing grid from the Protools Grids section:
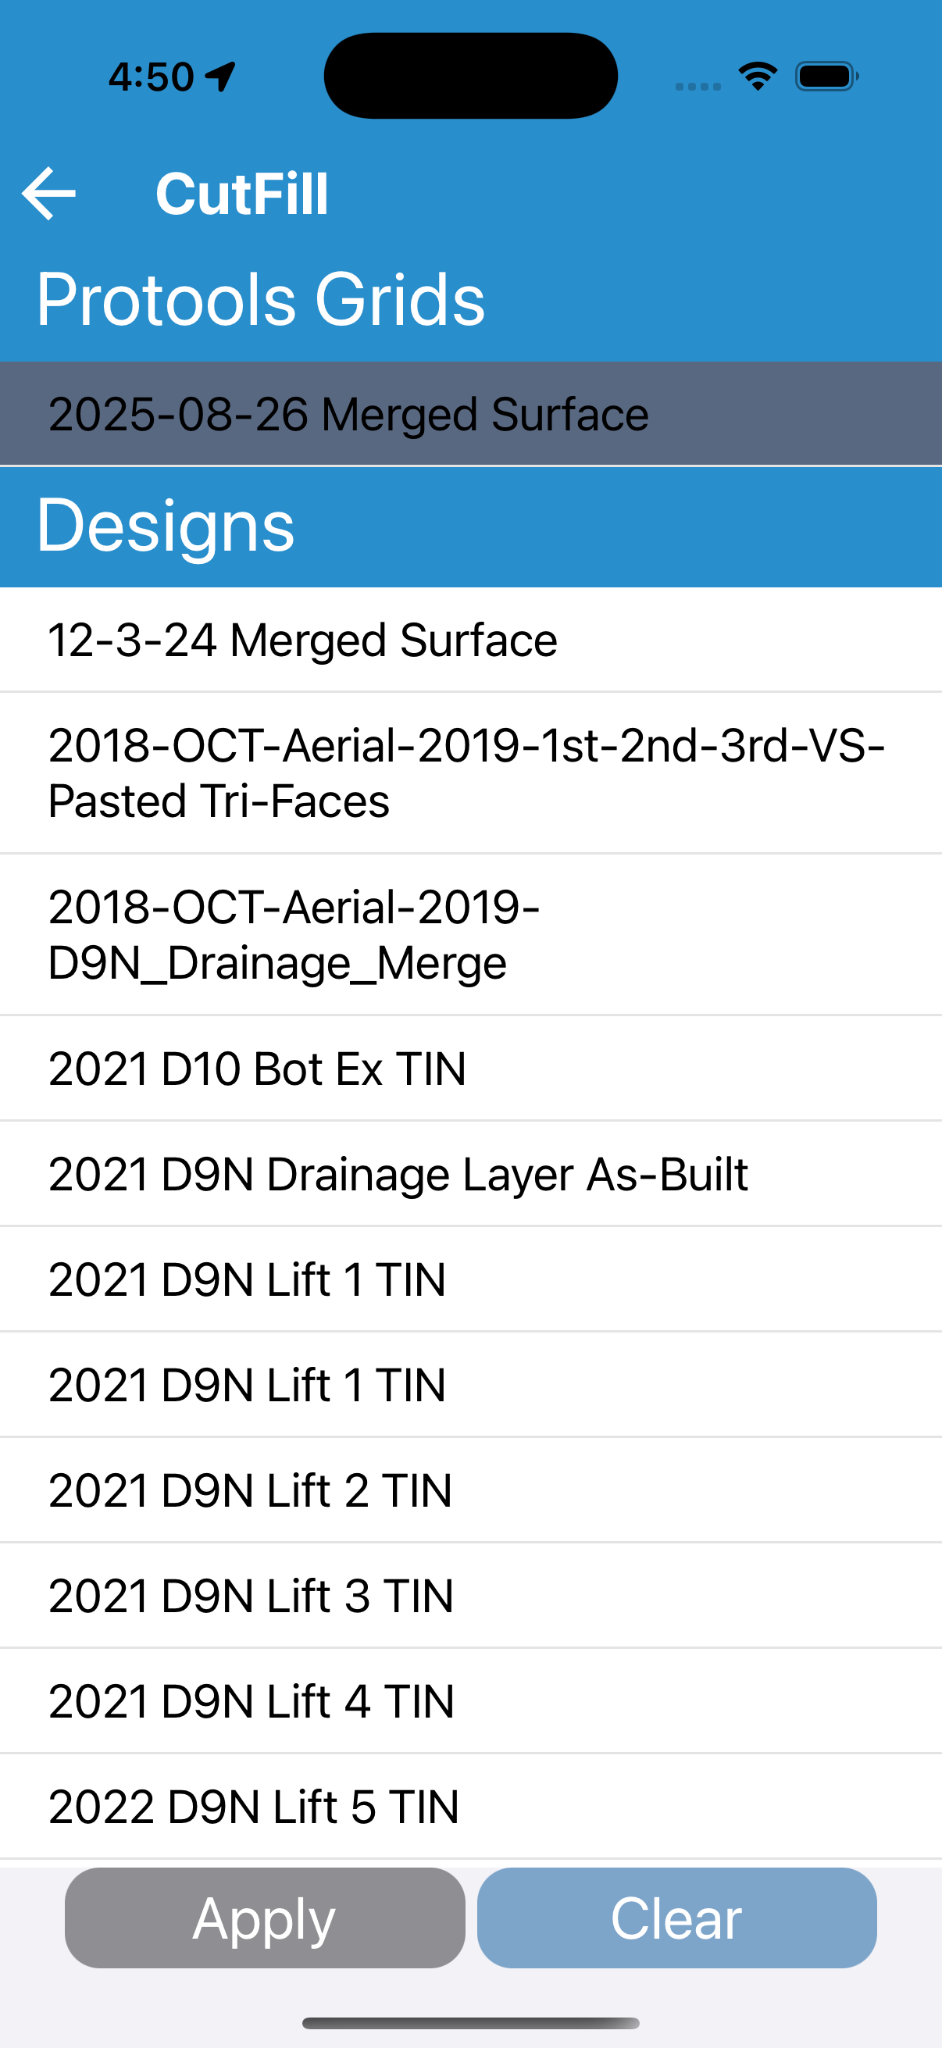
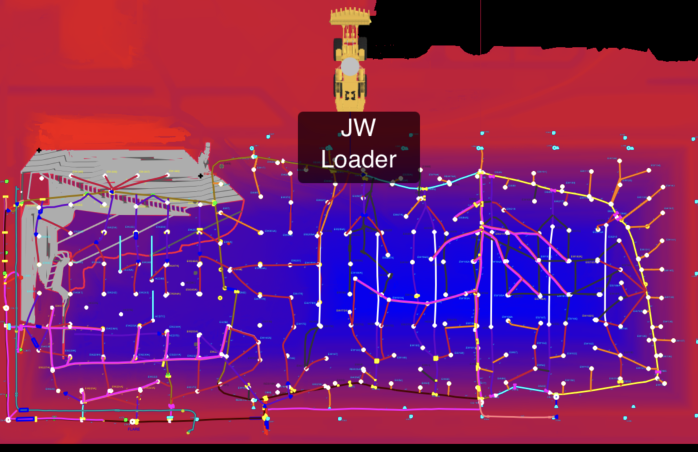
Existing Surface Selected, Apply disabled - Next select a design grid. Once both an initial and design are selected the Apply button is enabled:
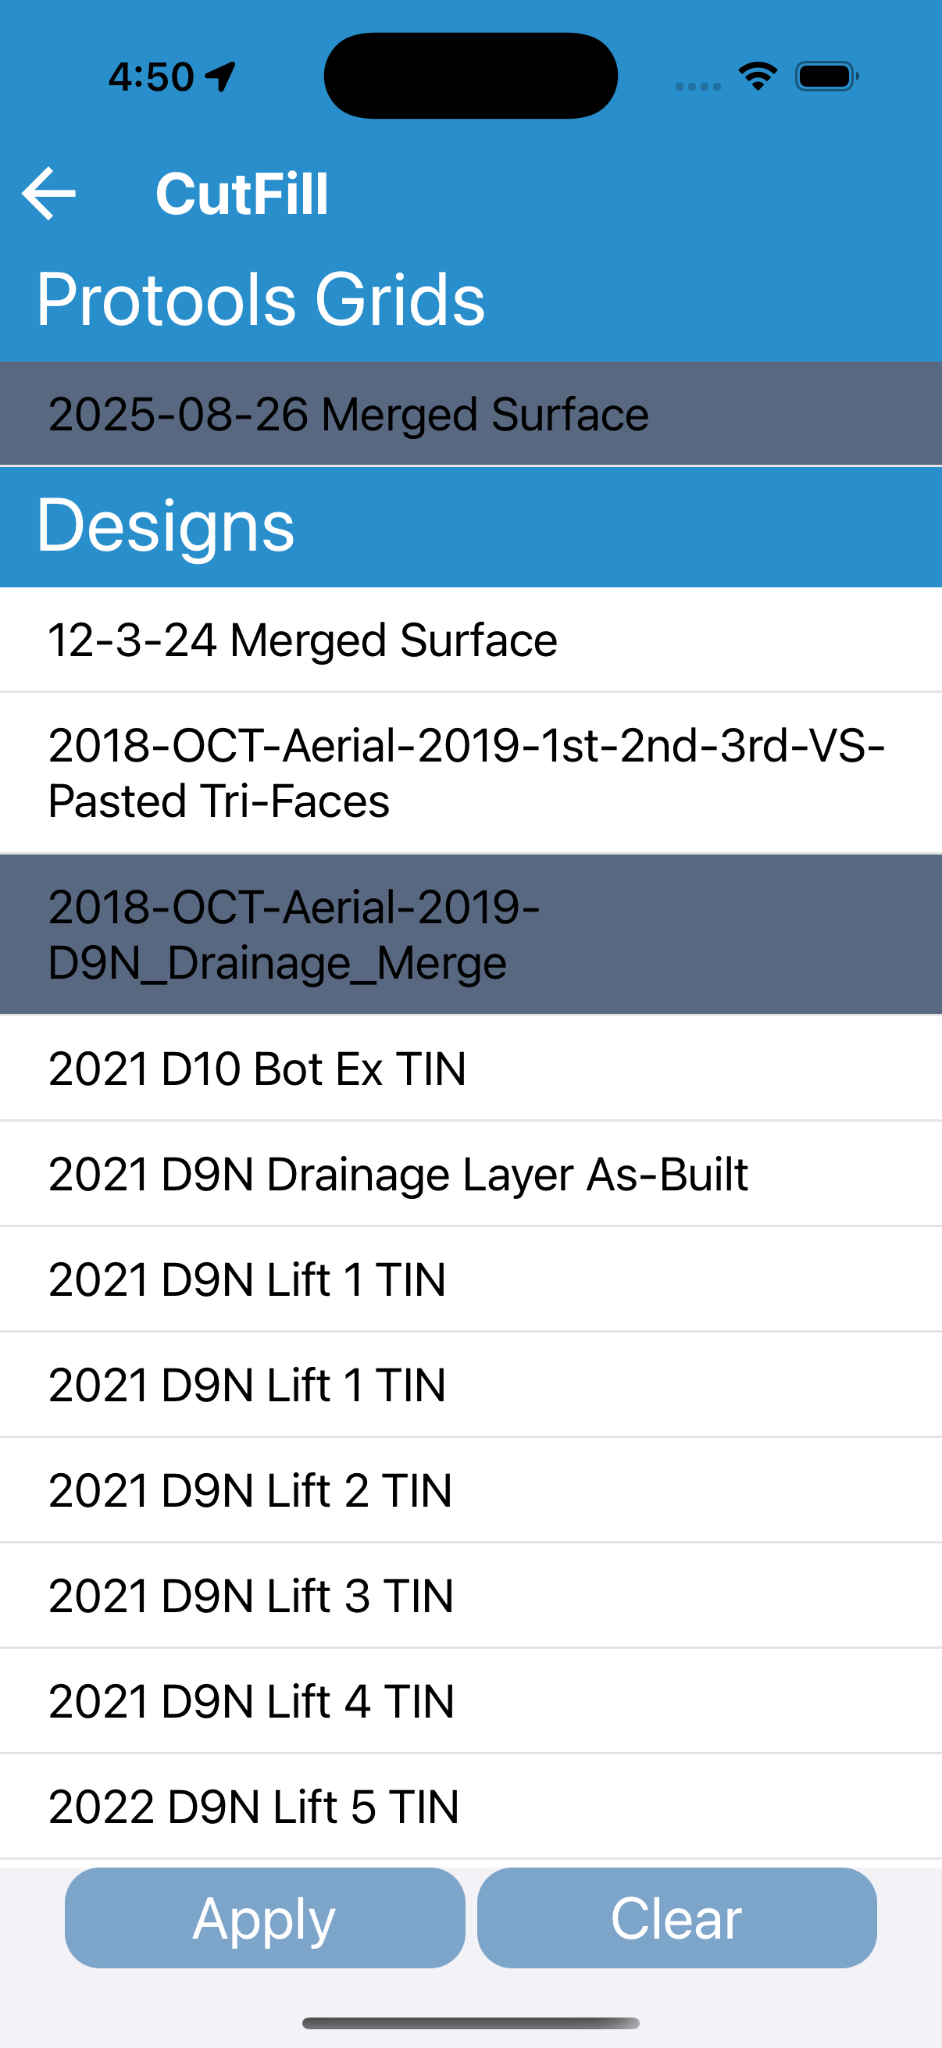
Design Surface Selected, Apply enabled Note: Tapping the Clear button deselects all selected items and clears the Cut/Fill from the map.
- Tapping Apply loads the cut/fill and navigates to the map:
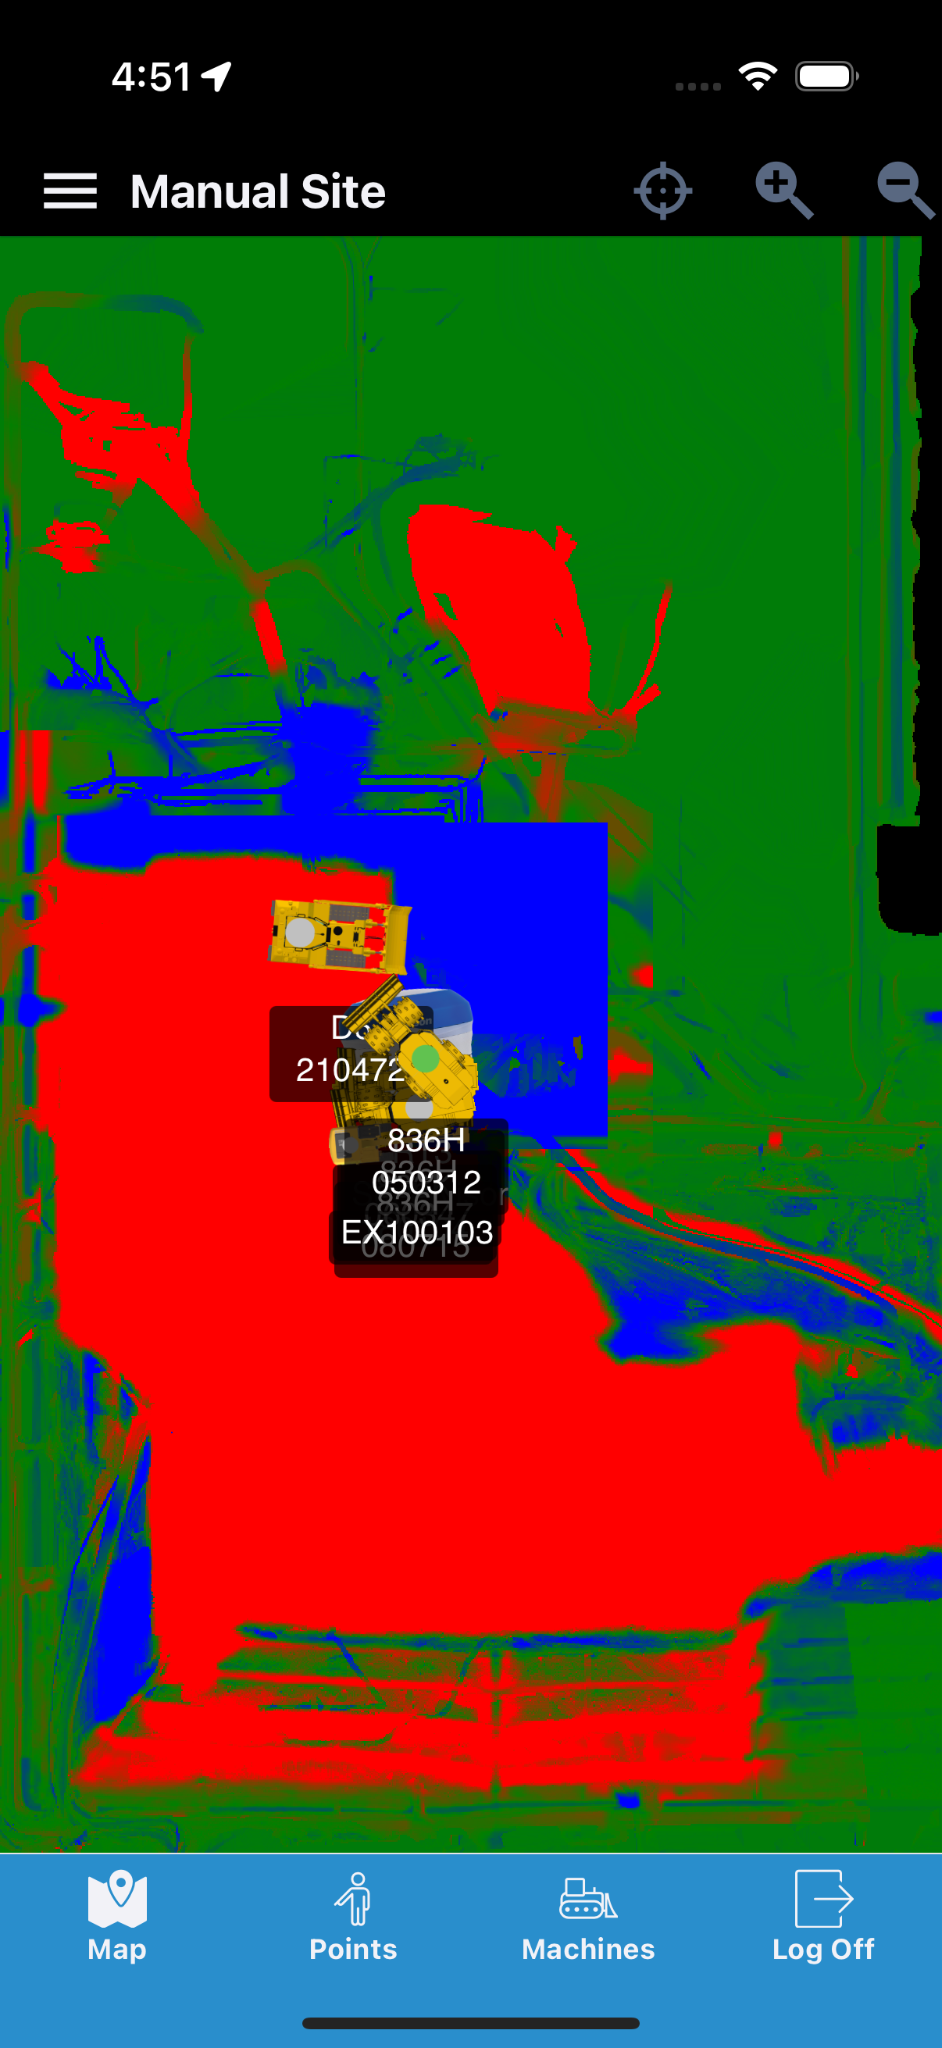
Cut/Fill Results Computed and Loaded
Map Drawing
The Map Drawing screen enables selection of one or more Linework files and up to one Surface file to display on the map.
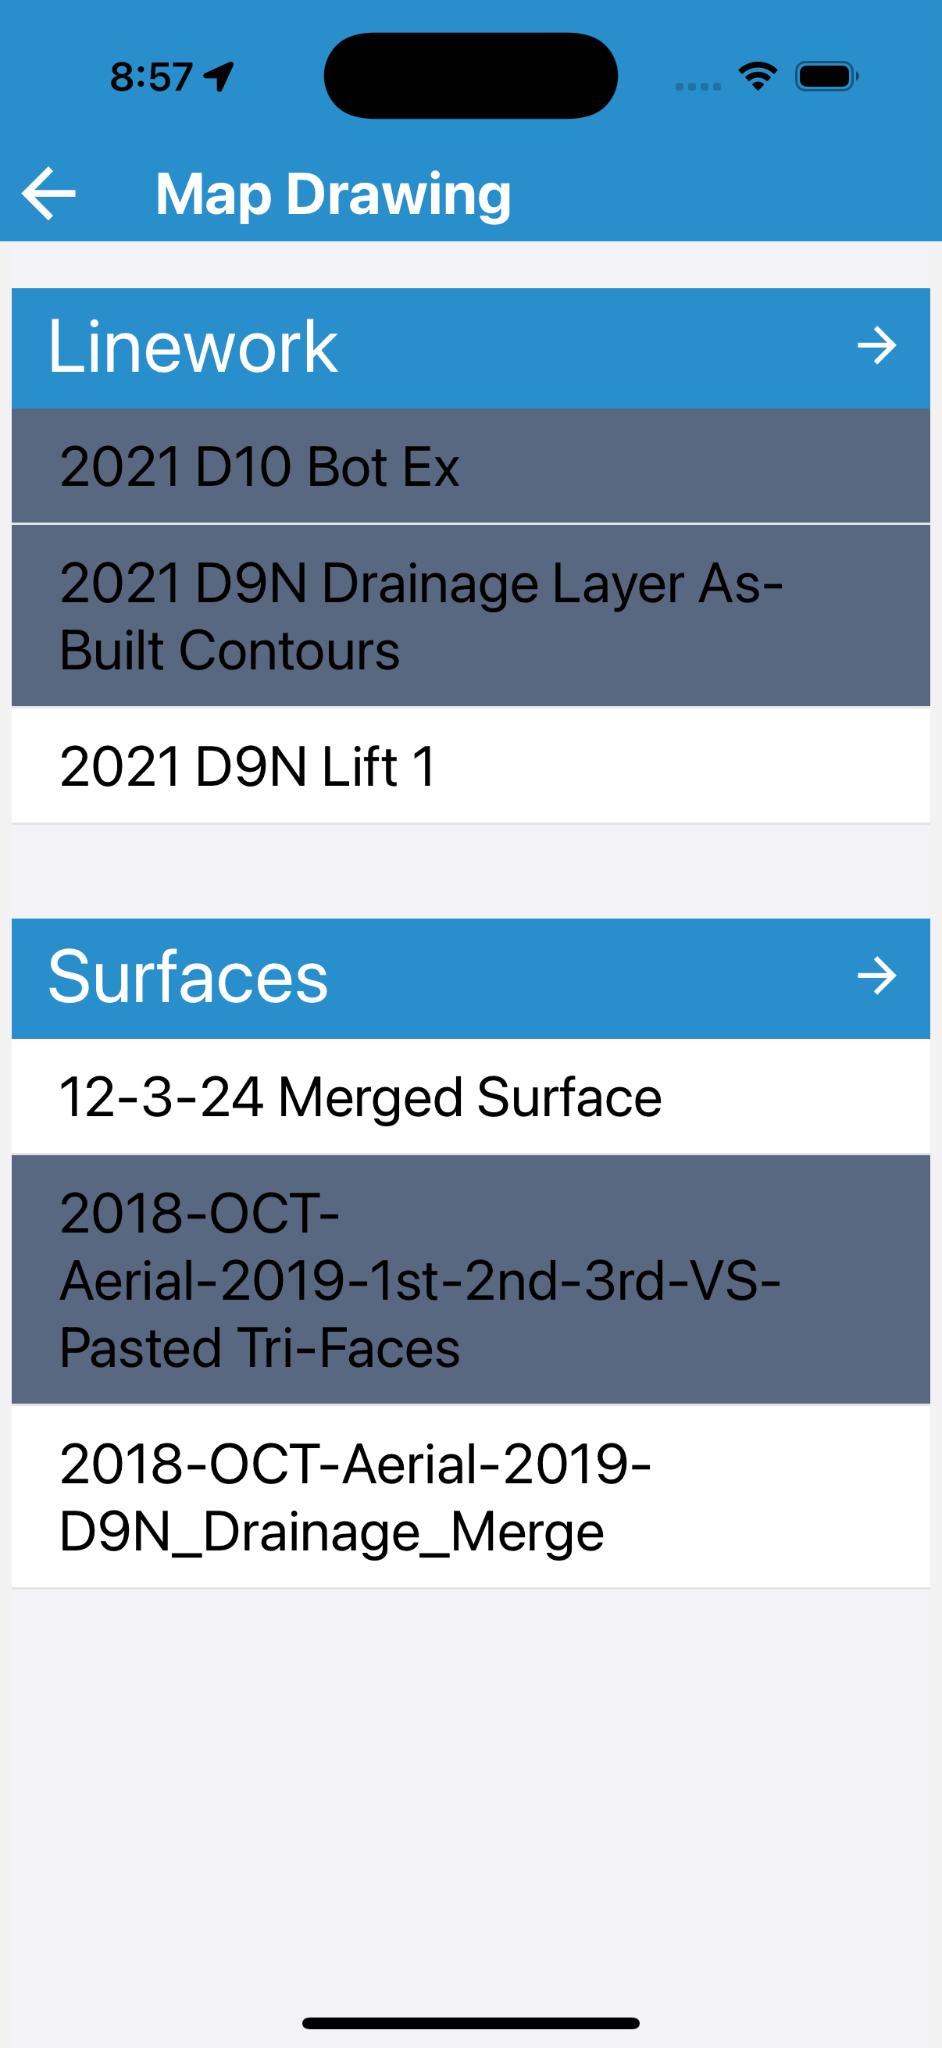
Map Drawing Interface Reference
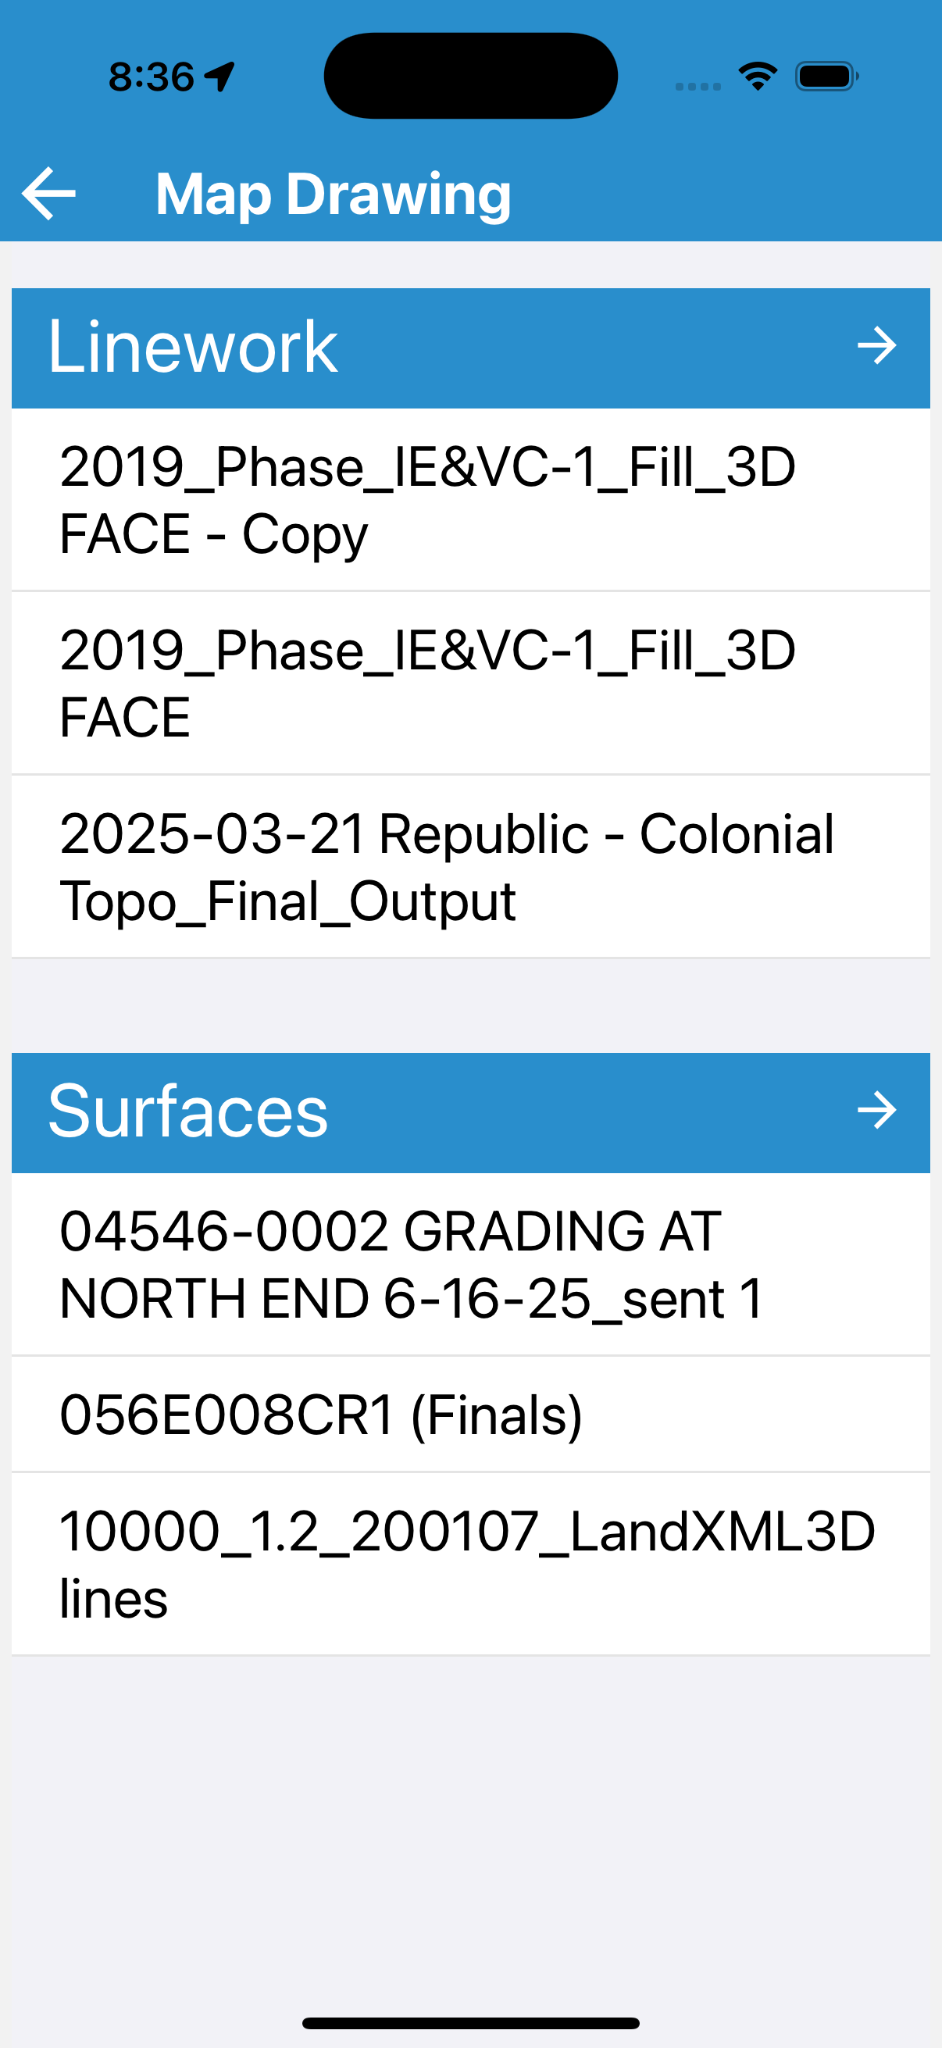
- The Linework section shows the first several linework files available for the selected site.
- The Surfaces section shows the first several surface files available for the selected site.
- Tapping an item will load it on the map and highlight it on the list.
- Tapping the Right Arrow (→) at the top of a section will navigate to the full list for that section.
| Linework List | Surfaces List |
|---|---|
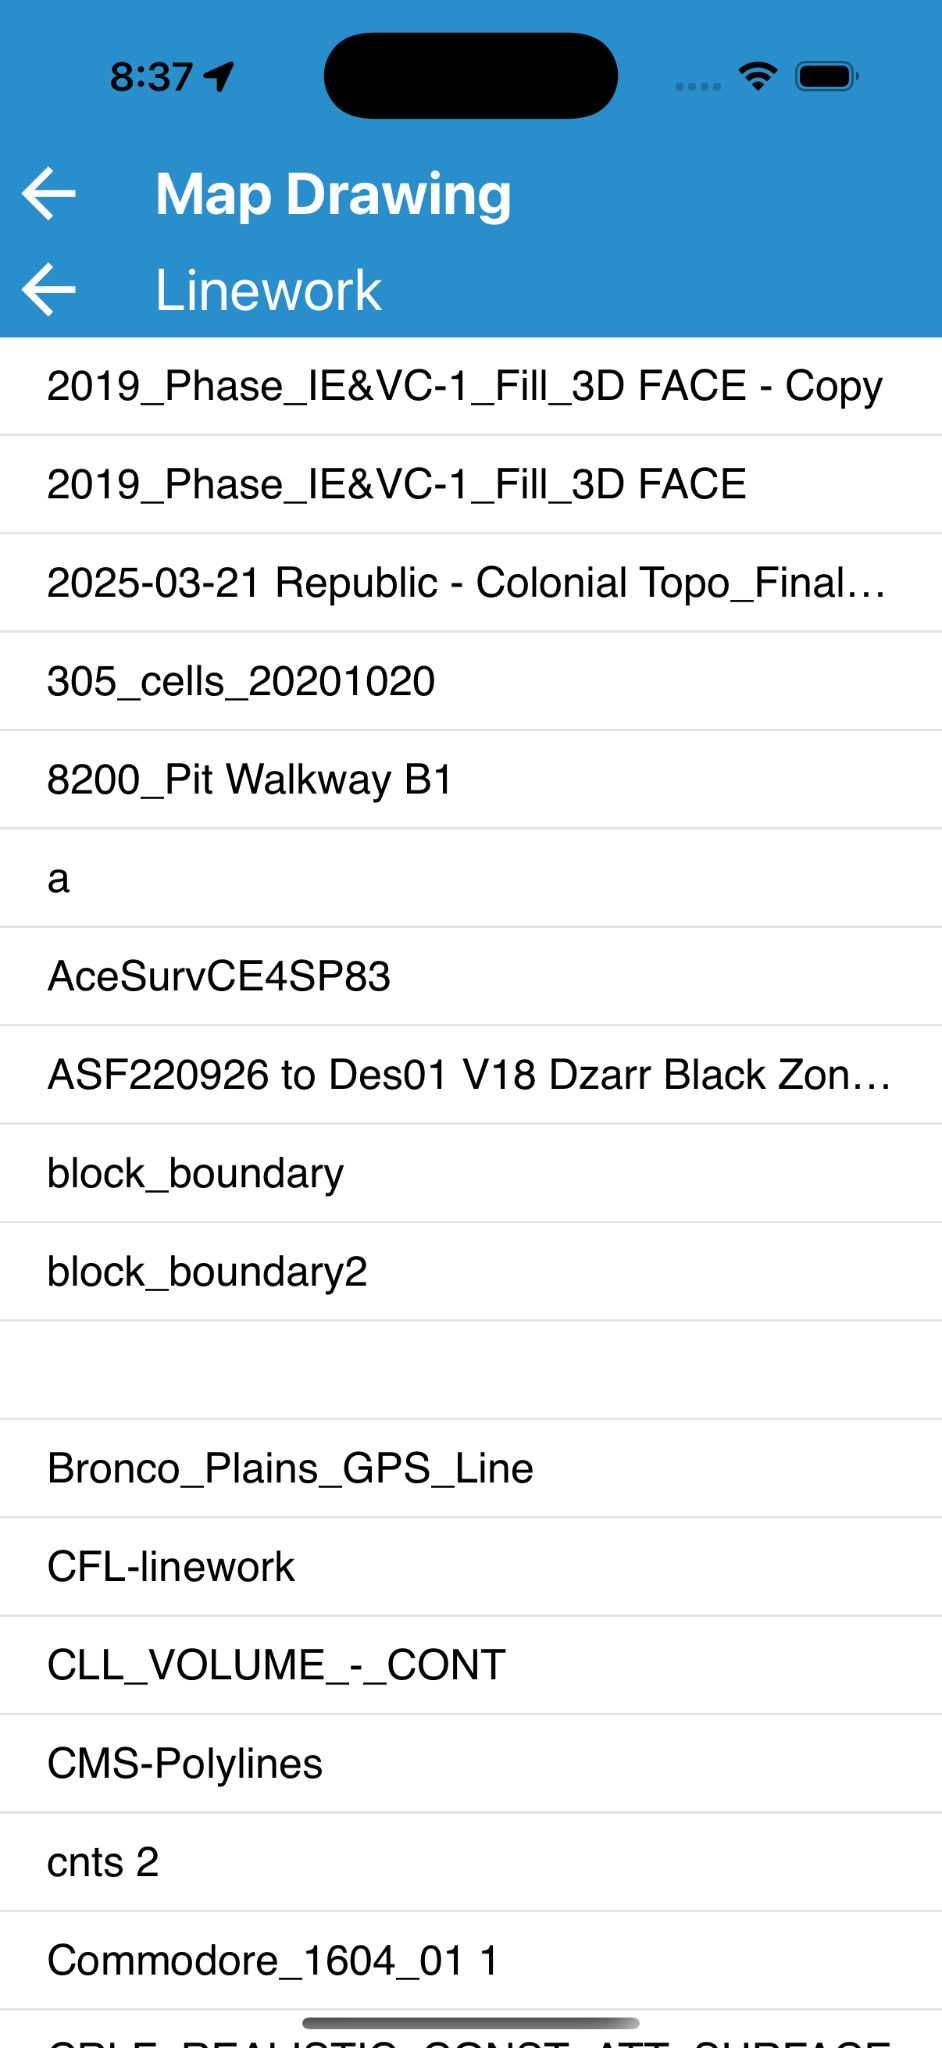 |
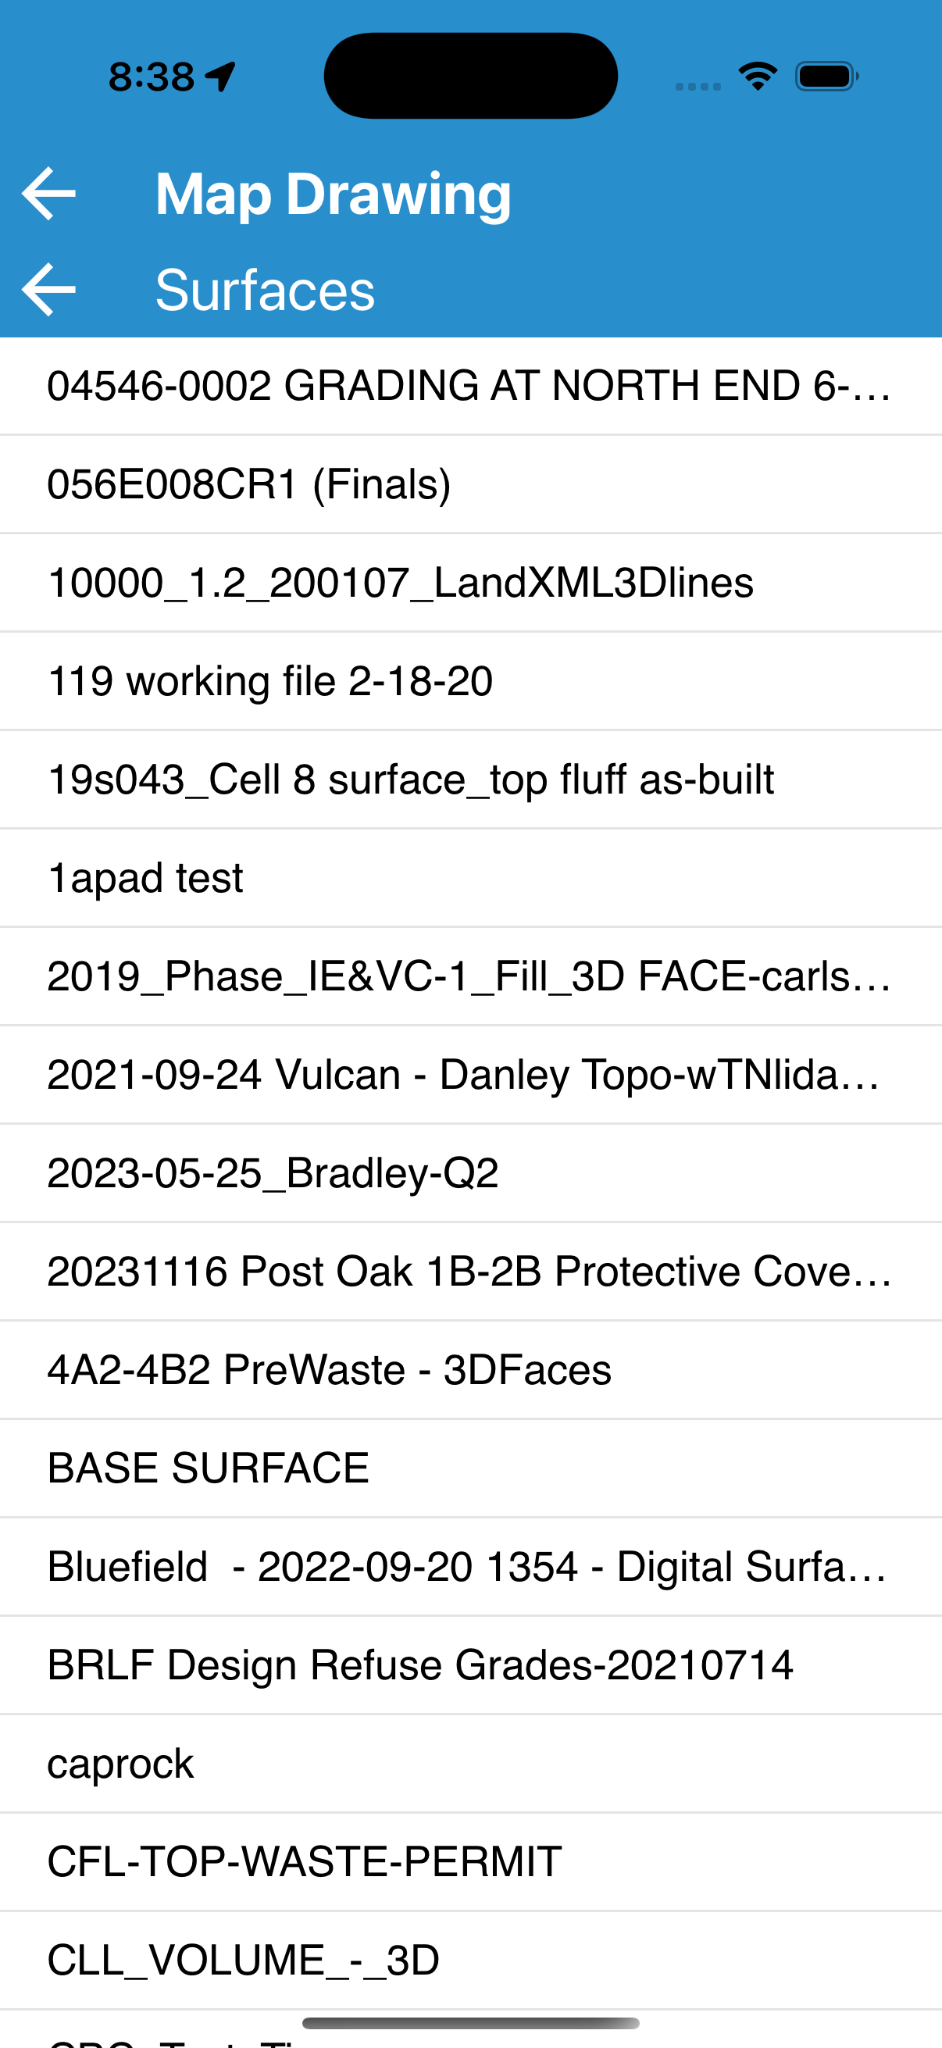 |
Note: Pulling down on the list will trigger a list refresh and fetch updates from the server.
- Tapping the Left Arrow (← Map Drawing) at the top left of the screen will return to the Map View to display the selection.
- Tapping the Left Arrow (← Linework or ← Surfaces) at the bottom left will return to the Map Drawing screen.
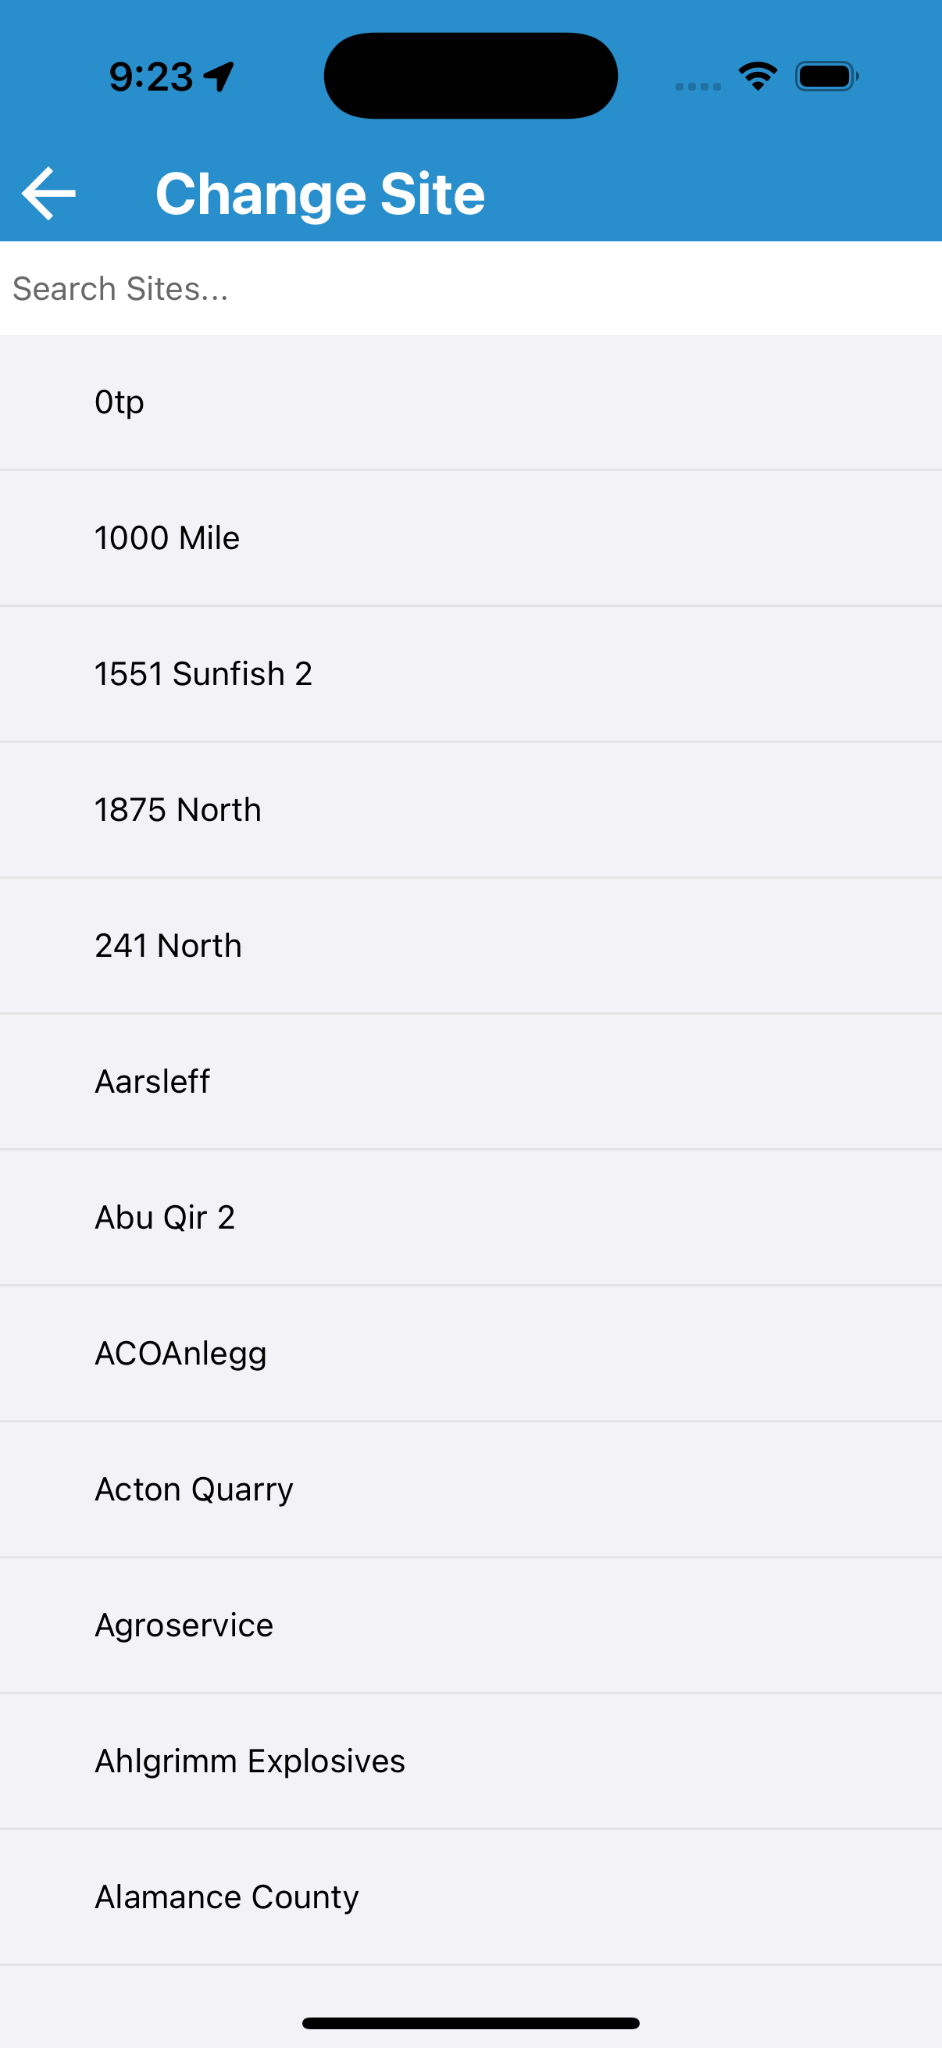
Change Site
From the Change Site screen, you can see all the sites to which you have access. You can swipe and scroll to find the desired site or use the Search Sites... bar to search for the desired site.
Note: If you begin typing in the Search Sites field, the list will begin displaying site names that match the text (not case-sensitive).
Change Site Interface Reference
| Full Site List | Filtered Site List (Carlson) |
|---|---|
 |
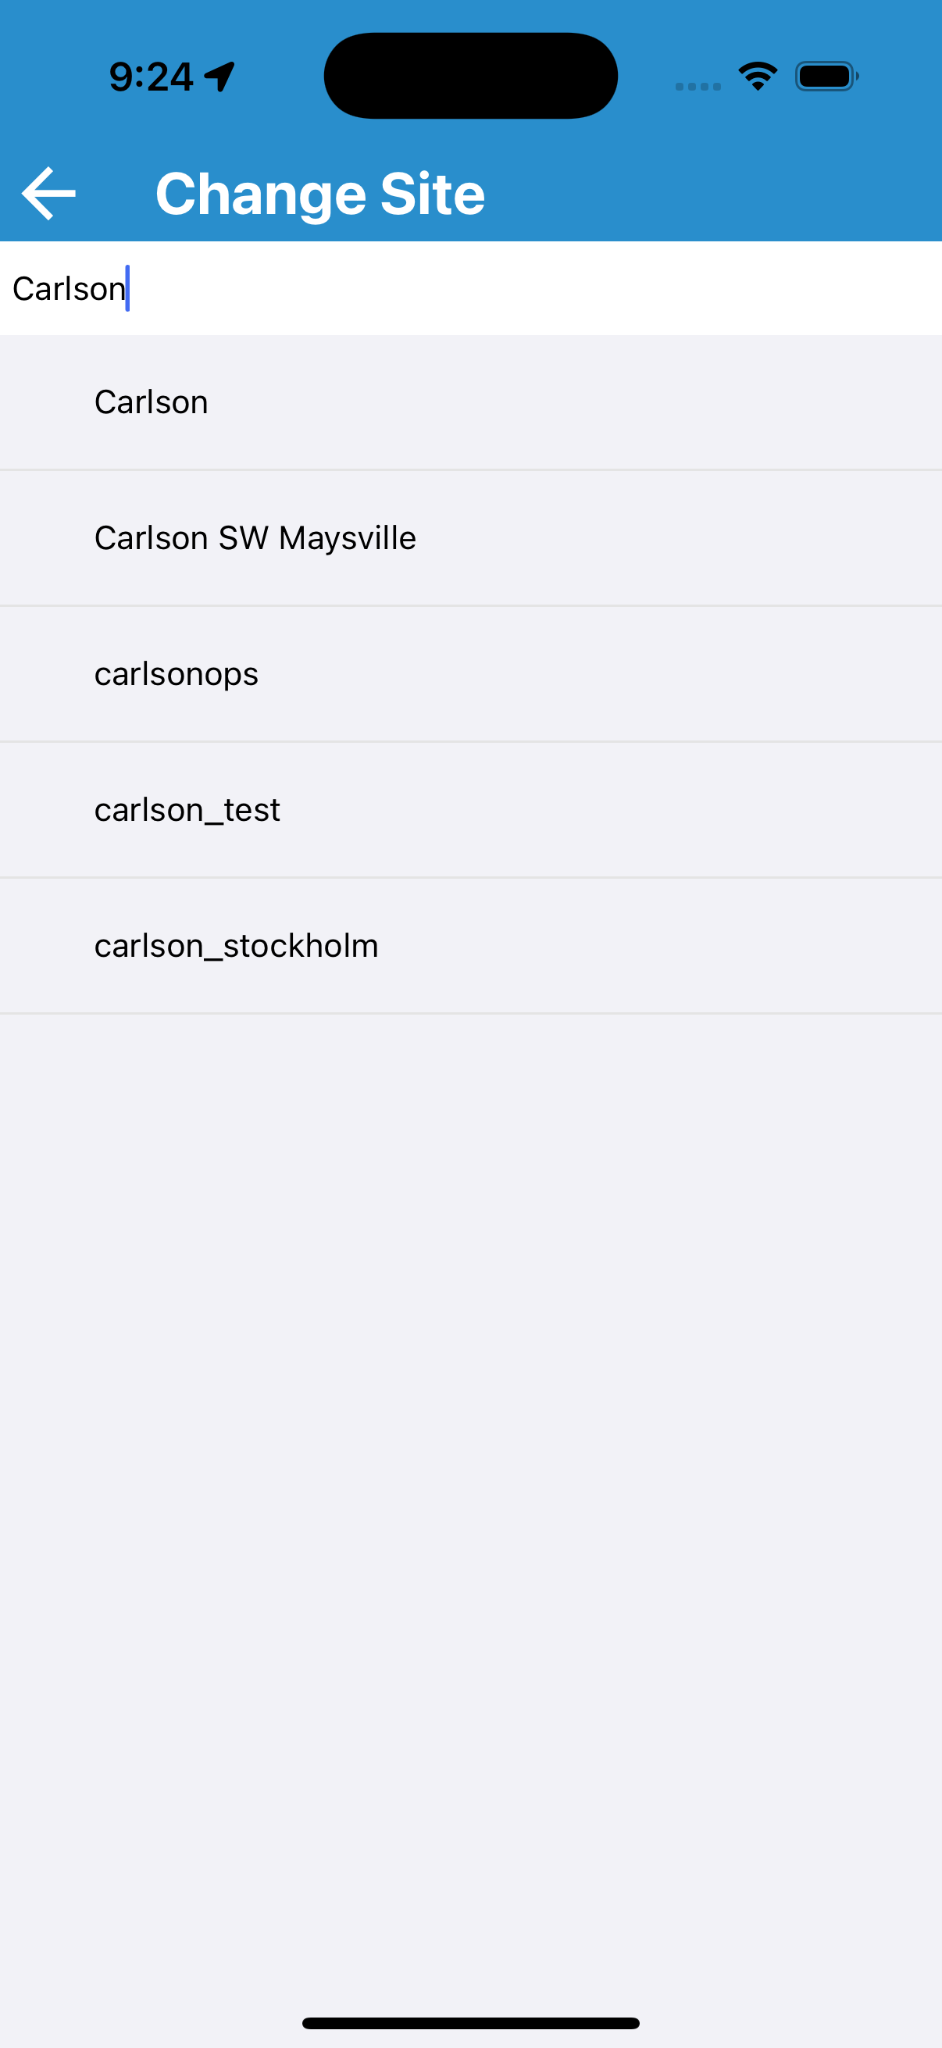 |
Tapping an item in the list will begin loading the new site. When loading is complete, the Map View will be shown for the newly selected site.
File Upload
From the File Upload screen, select a file from the device's file system and upload it to Command. The selected file can be added to files, imported as a linework, or imported as a surface. Files uploaded from a mobile device can be viewed on the mobile device or on Command Desktop.
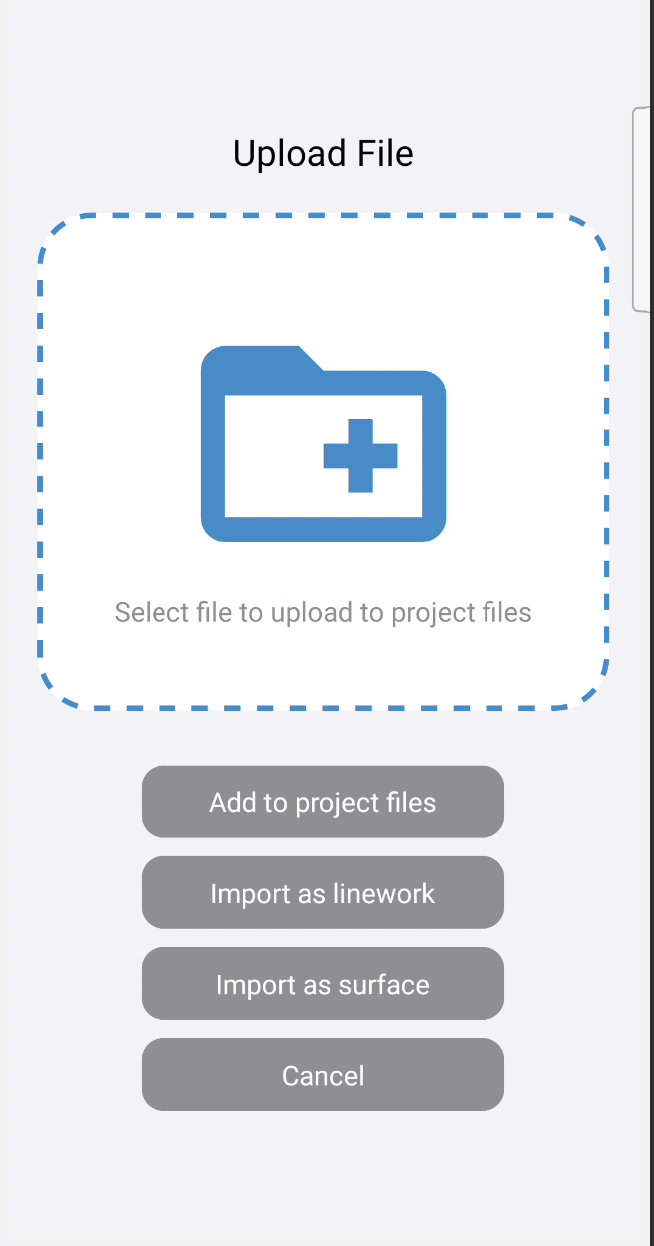
File Upload Interface Reference
- Tap the Folder icon to display the device's file picker.
- From the file picker, select one file and confirm.
Note: For more information on the file picker, please consult your device manual.
- Once a file is selected the folder icon becomes a document icon and its name is displayed underneath.
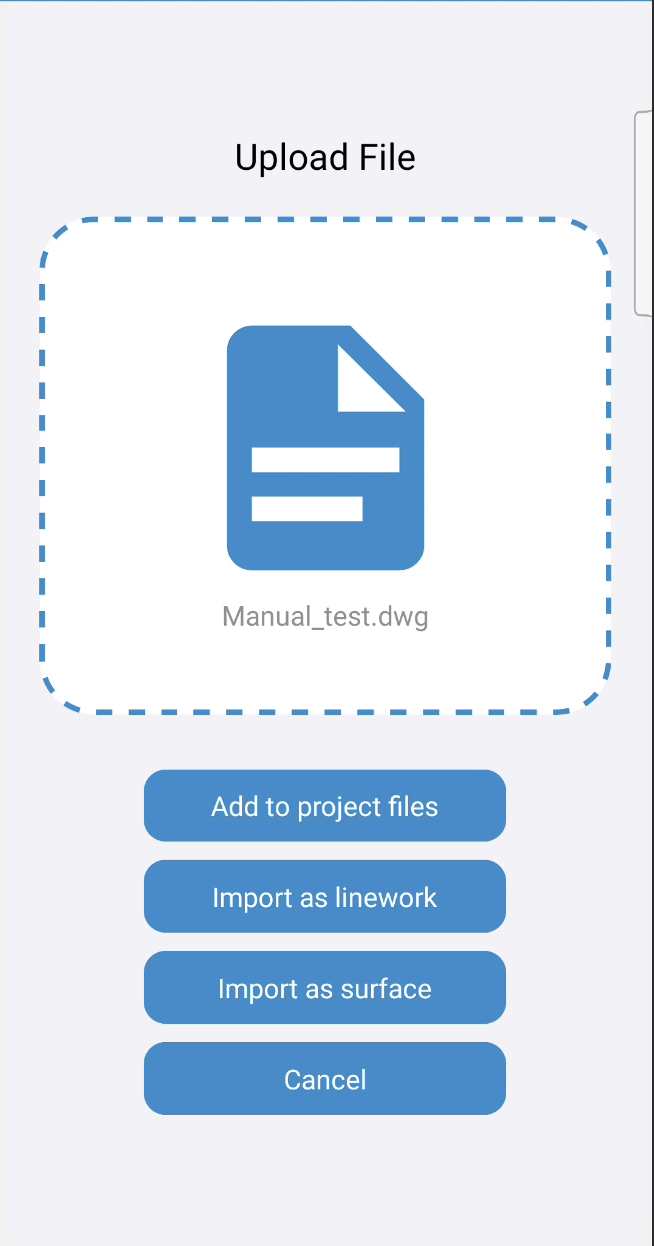
File Selected File Upload Options Option Description 
Adds the selected file to the file list. 
Imports the selected file as a linework file. 
Imports the selected files as a surface file. 
Cancels the file selection process.
Settings
The Settings screen allows adjusting settings specific to Command Mobile.
Note: These settings are local and set per device.
Note: Changes to Settings are saved as they are made, so no confirm nor save action is necessary.
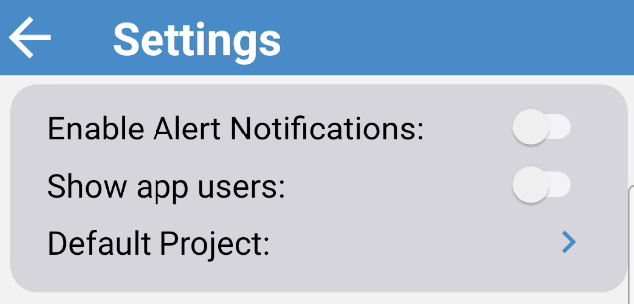
The settings screen defaults to no settings selected. As settings are enabled, additional relevant settings are revealed.
Settings Reference
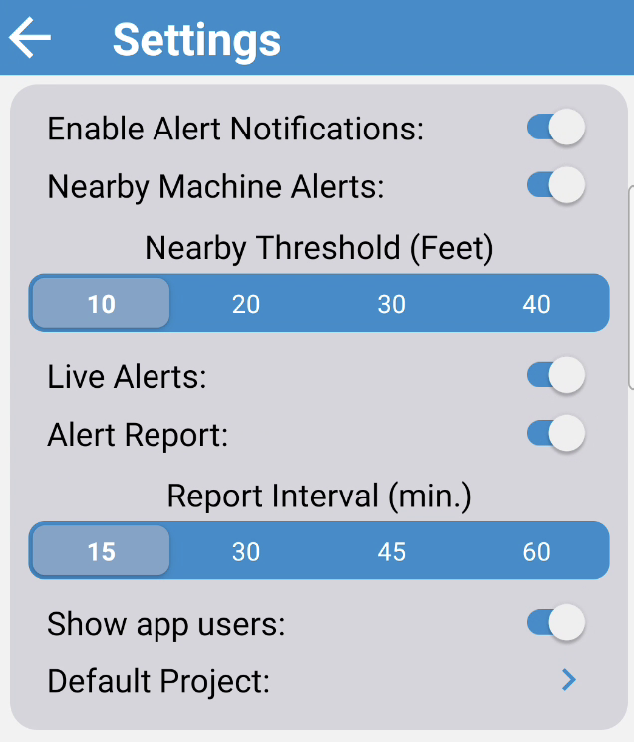
- Enable Alert Notifications: Controls if this device receives Machine Alert Notifications.
- Nearby Machine Alerts: Controls if this device should trigger a notification for the user being within the Nearby Threshold of an active machine.
- Nearby Threshold: sets the threshold at which the user is "Near" a machine (measured in Feet or Meters depending on the units set at the site).
- Live Alerts: Controls if Machine Alerts should trigger a device notification as they happen.
- Alert Report: Controls if Machine Alerts should be batched and displayed in a list.
- Report Interval: Controls the frequency of Alert Report notification in minutes.
- Nearby Machine Alerts: Controls if this device should trigger a notification for the user being within the Nearby Threshold of an active machine.
- Show App Users: Controls if other app users should be displayed in the Map View.
- Default Project: Sets the project that should be loaded in the Map View on login.
Note: Disabling a parent setting will functionally disable any/all child settings but enabling that parent setting will enable child settings with any previously set selections intact.
Default Project Selection Reference
- Tap the Default Project control to display a list of projects for the currently selected site:
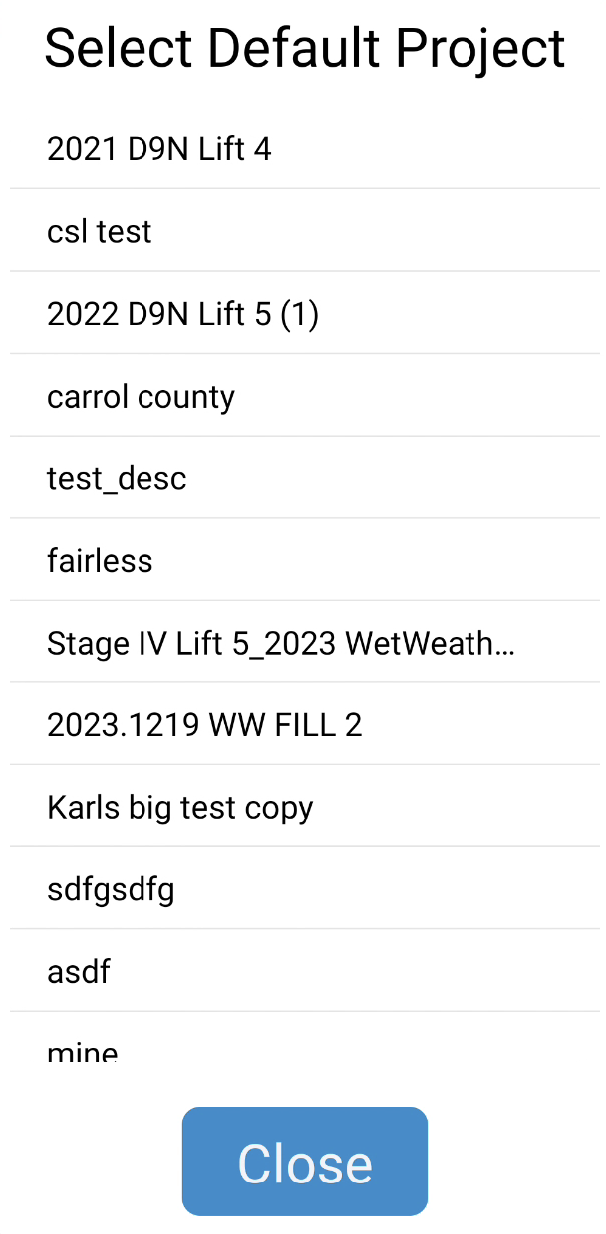
Available Project List - Tap a project in the Projects list to highlight it and set it as the default project.
- Tapping Close closes the Project selection list and the name of the default project is displayed next to the setting:
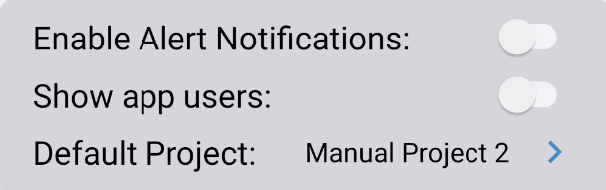
Default Project Set
Alert Report
The Alert Report screen displays a list of machine down alerts that have happened during the interval set by the Report Interval setting in the Settings screen.
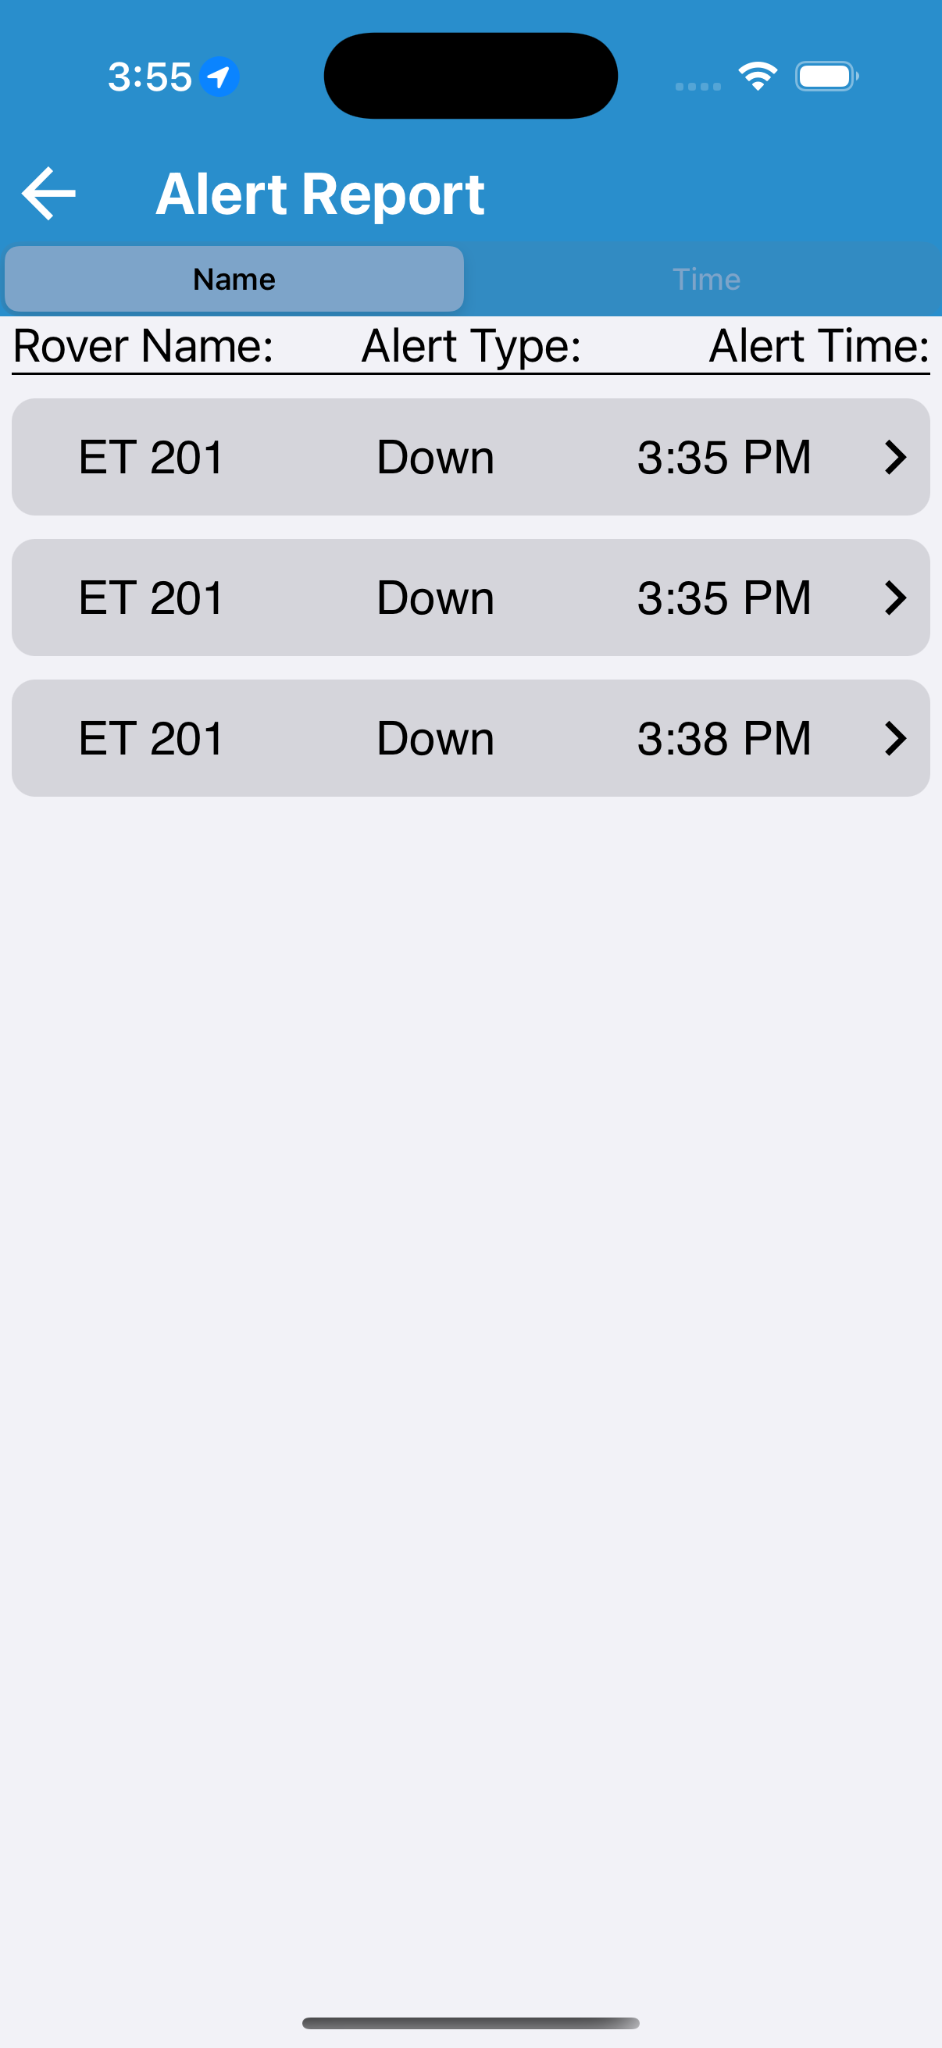
Alert Report Interface Reference
- Tap the Name/Time control header to sort the list by Machine Name or by Time respectively.
- Tap an item in the list to navigate to the Alert Detail screen which displays the position of the machine when the alert was triggered:
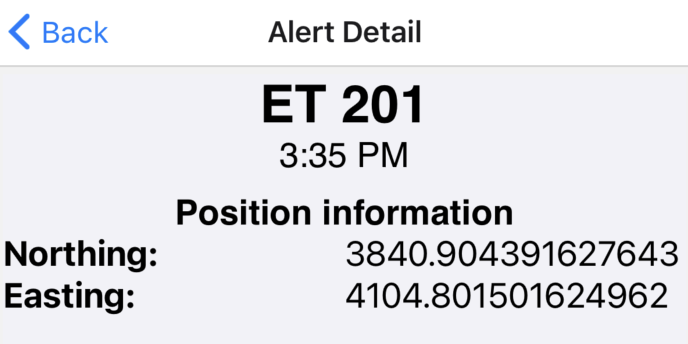
Alert Detail
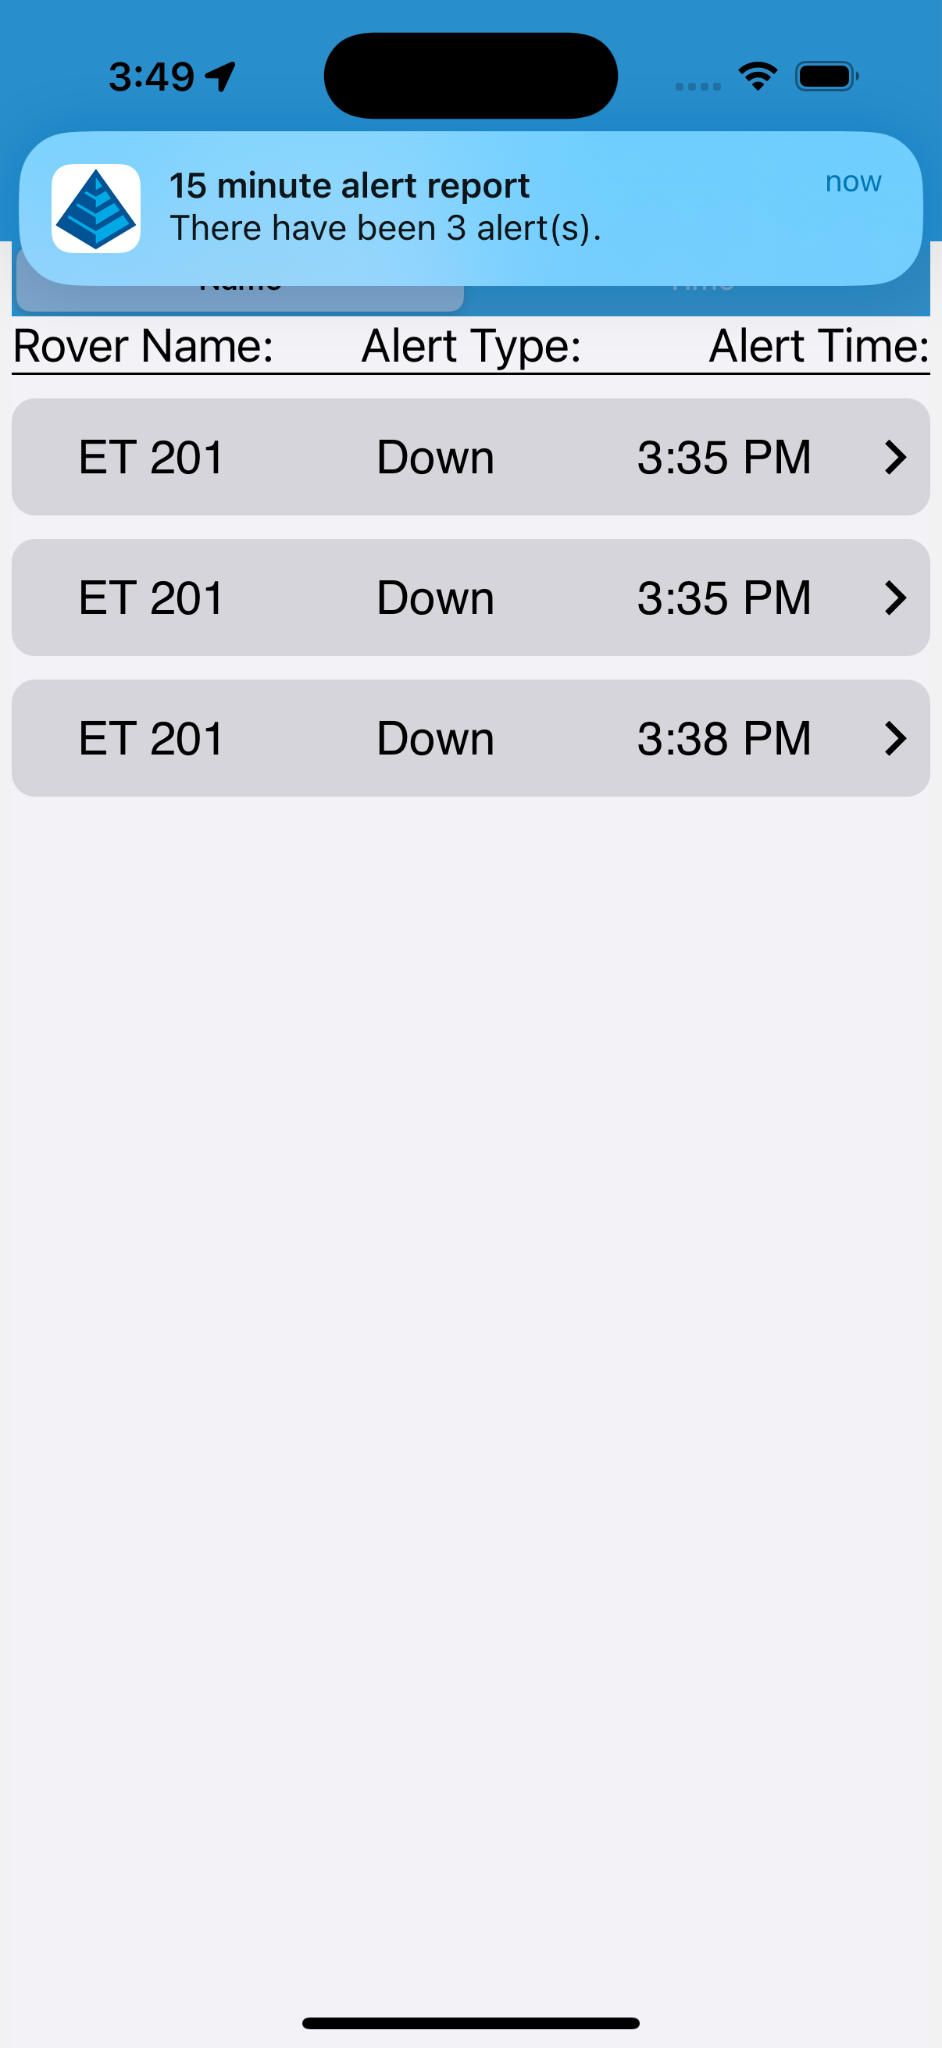
An example of the notification when the Alert report is ready.
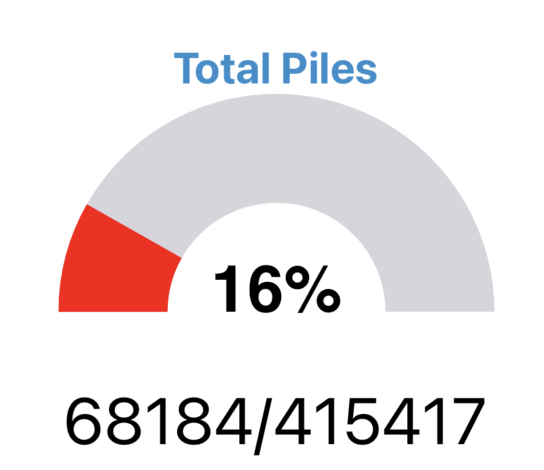
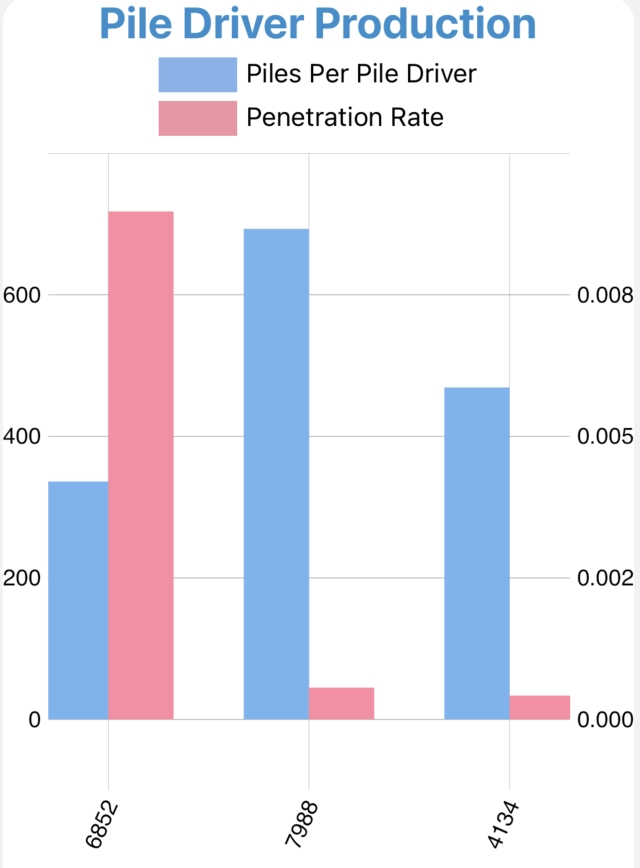
Dashboard
The Site Dashboard shows various graphs composed of site data recorded over the past 24 hours.
Dashboard Graph Reference
Note: The graphs displayed depend on the data available.
| Report | Details |
|---|---|
|
|
|
|

|
|
Drill Report
From the Drill Report screen, select a range of dates or a drill folder to display holes from that date range or folder on the map.
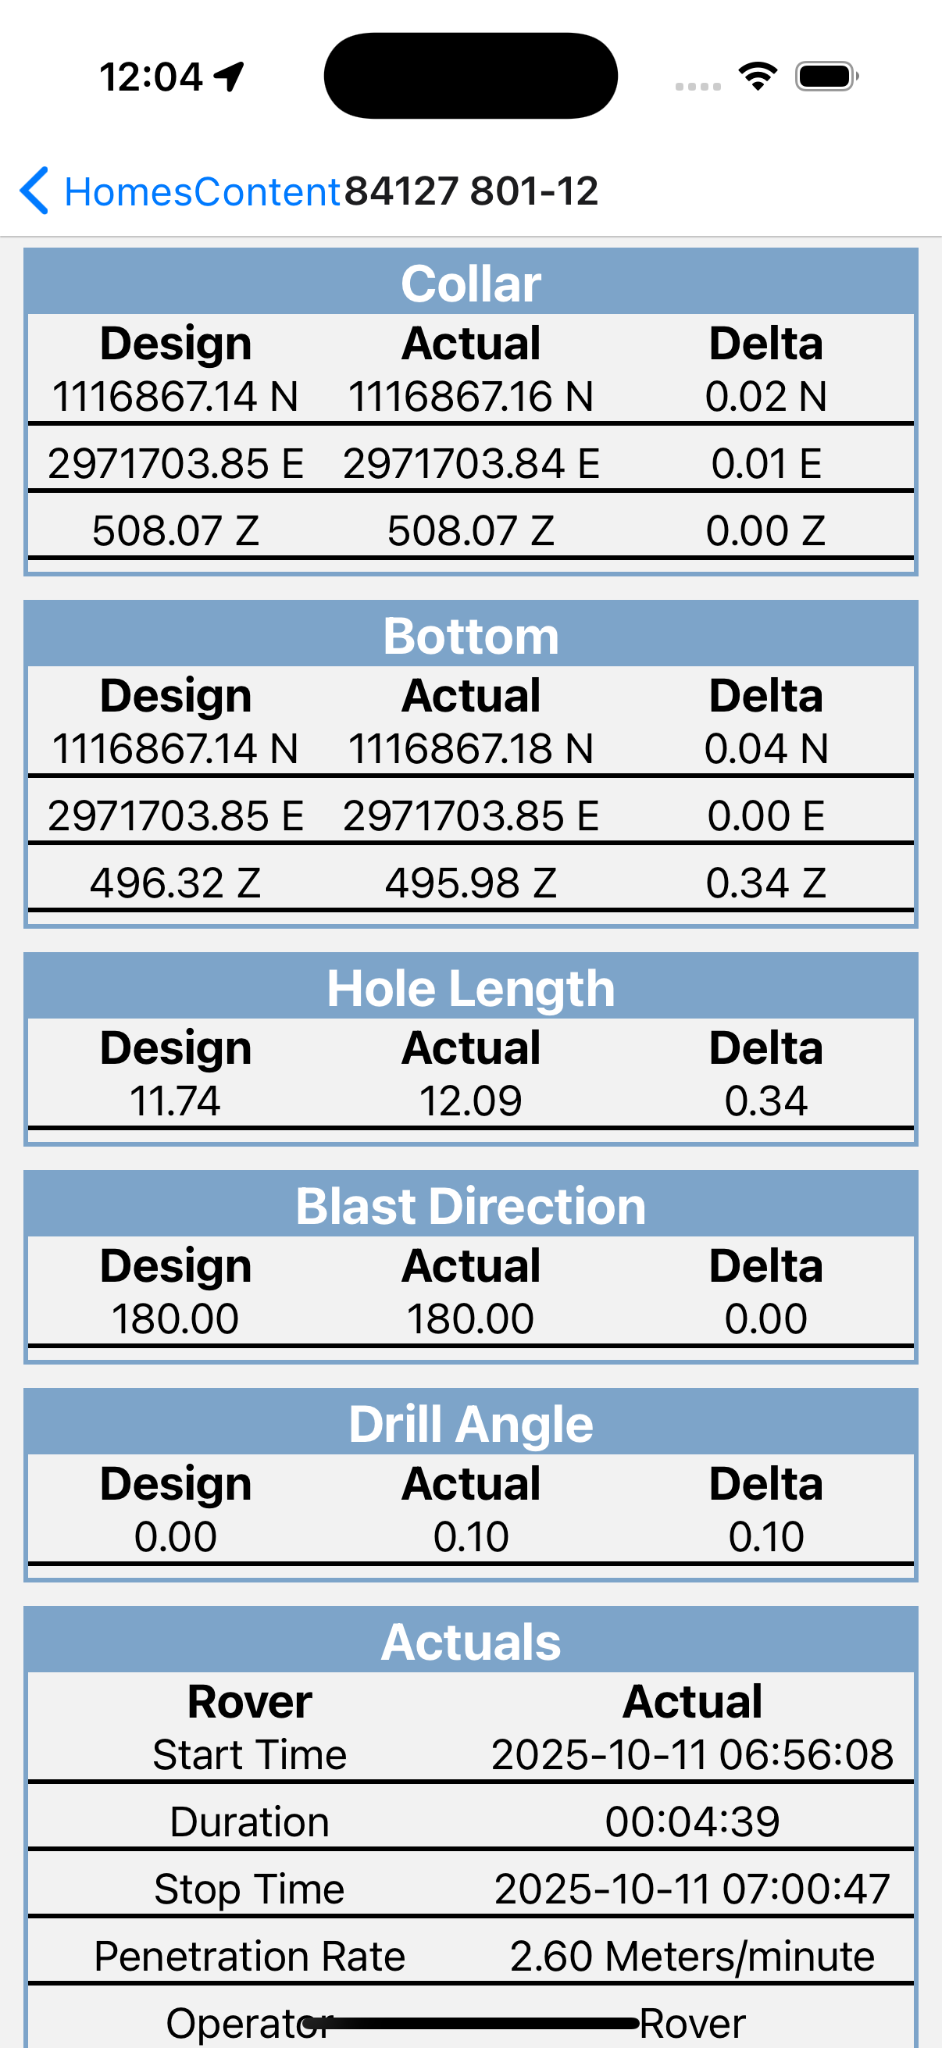
Note: Tapping a hole on the map brings up a summary report of that hole.
Hole Select Interface Reference
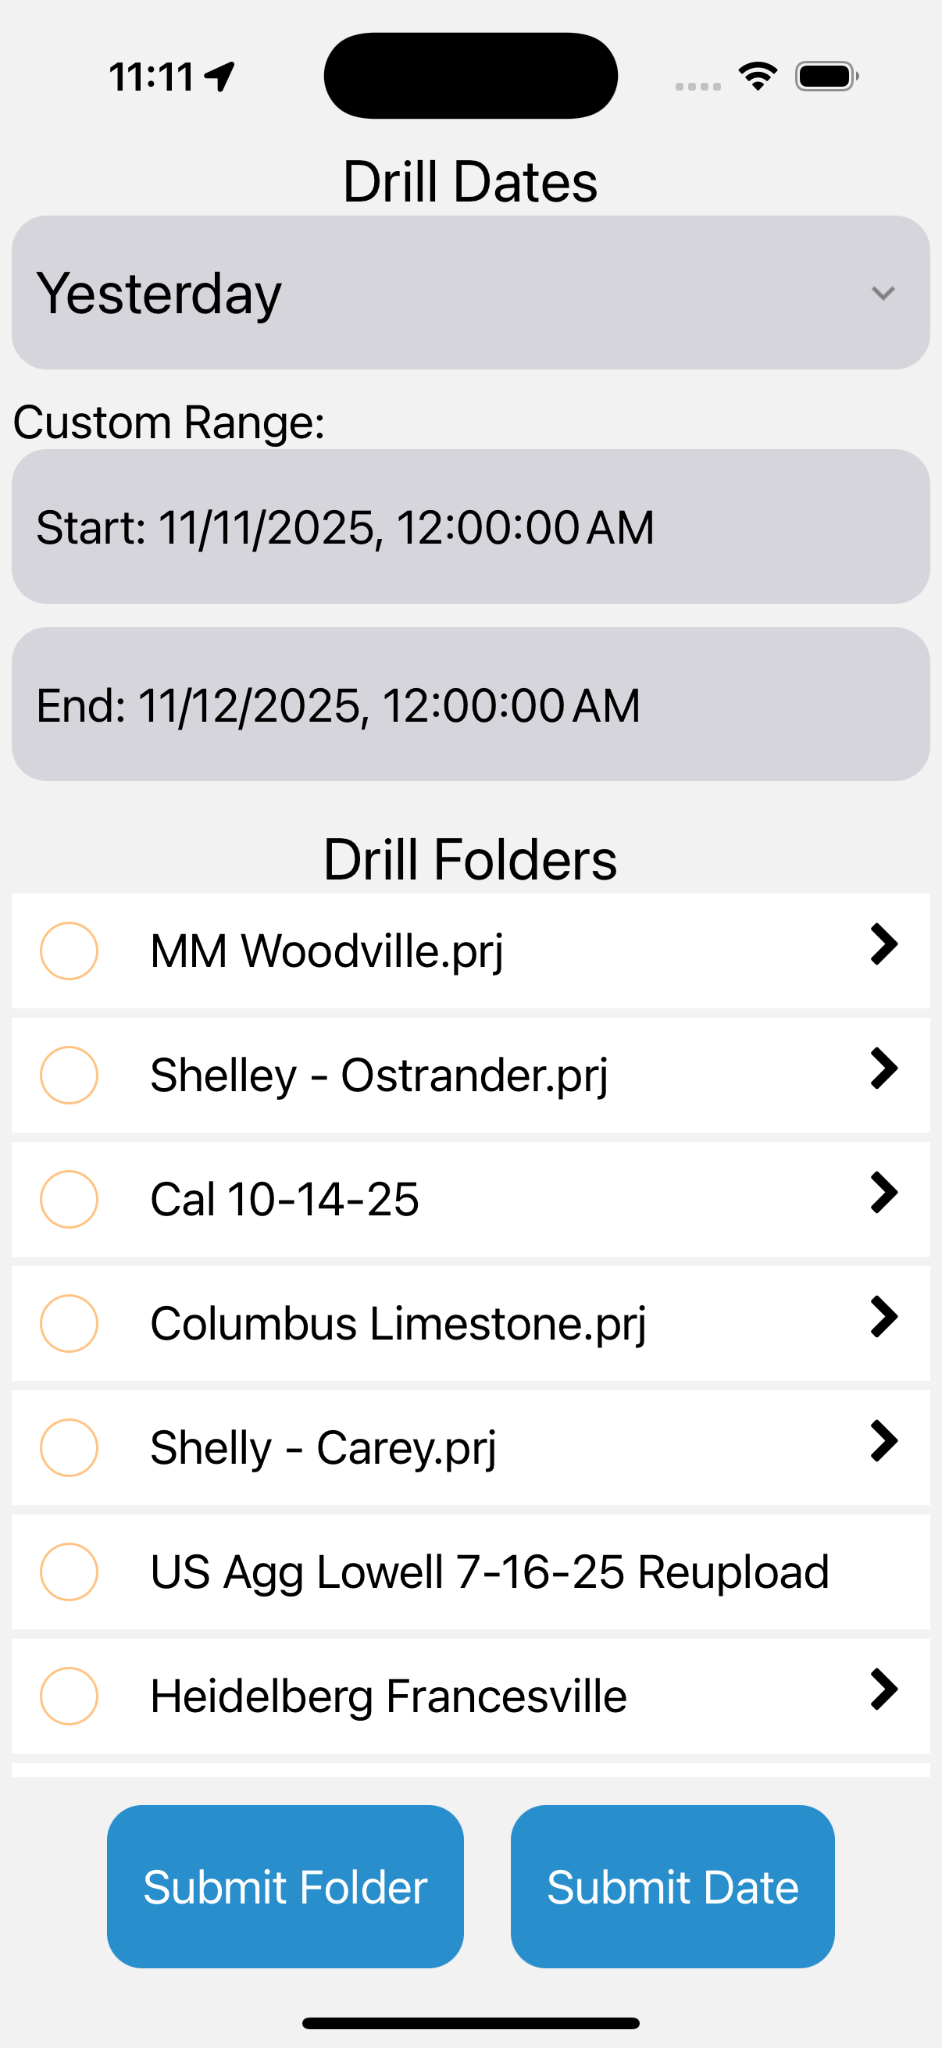
- Date Checkbox: Tapping the checkbox next to "Drill Dates" will enable or disable using a date range for the report
- Prefabricated date ranges:
- Today
- Yesterday
- Current Week
- Monday - Sunday
- Current Month
- 1st of month - Today
- Previous Month
- Last 31 Days
- Custom Range: Input a custom date range.
Note: The Start date must be before the End date.
- Drill Folders: Select one or more folders to load holes from. Selecting a parent folder selects all child folders.
Note: Folders can be tapped to expand them and see their contents.
- Folder Checkbox: Tapping the checkbox next to "Drill Folders" will select all folders
- Submit Submits the selected date range and/or folders to draw relevant holes on the map.
Holes Drawn on Map
Hole layouts will vary depending on site configuration, date selection, folder selection etc. Here is a basic example of holes drawn in the Map View:

Tapping a hole will display a hole report. Example pictured below:
Note: By default when loading the map Command Mobile will load the holes drilled in the last 24 hours
Pile Report
From the Pile Report screen, select a range of dates or a pile folder to display piles from that date range or folder on the map. Tapping a pile on the map will brings up a summary of that pile.
Pile Select Interface Reference
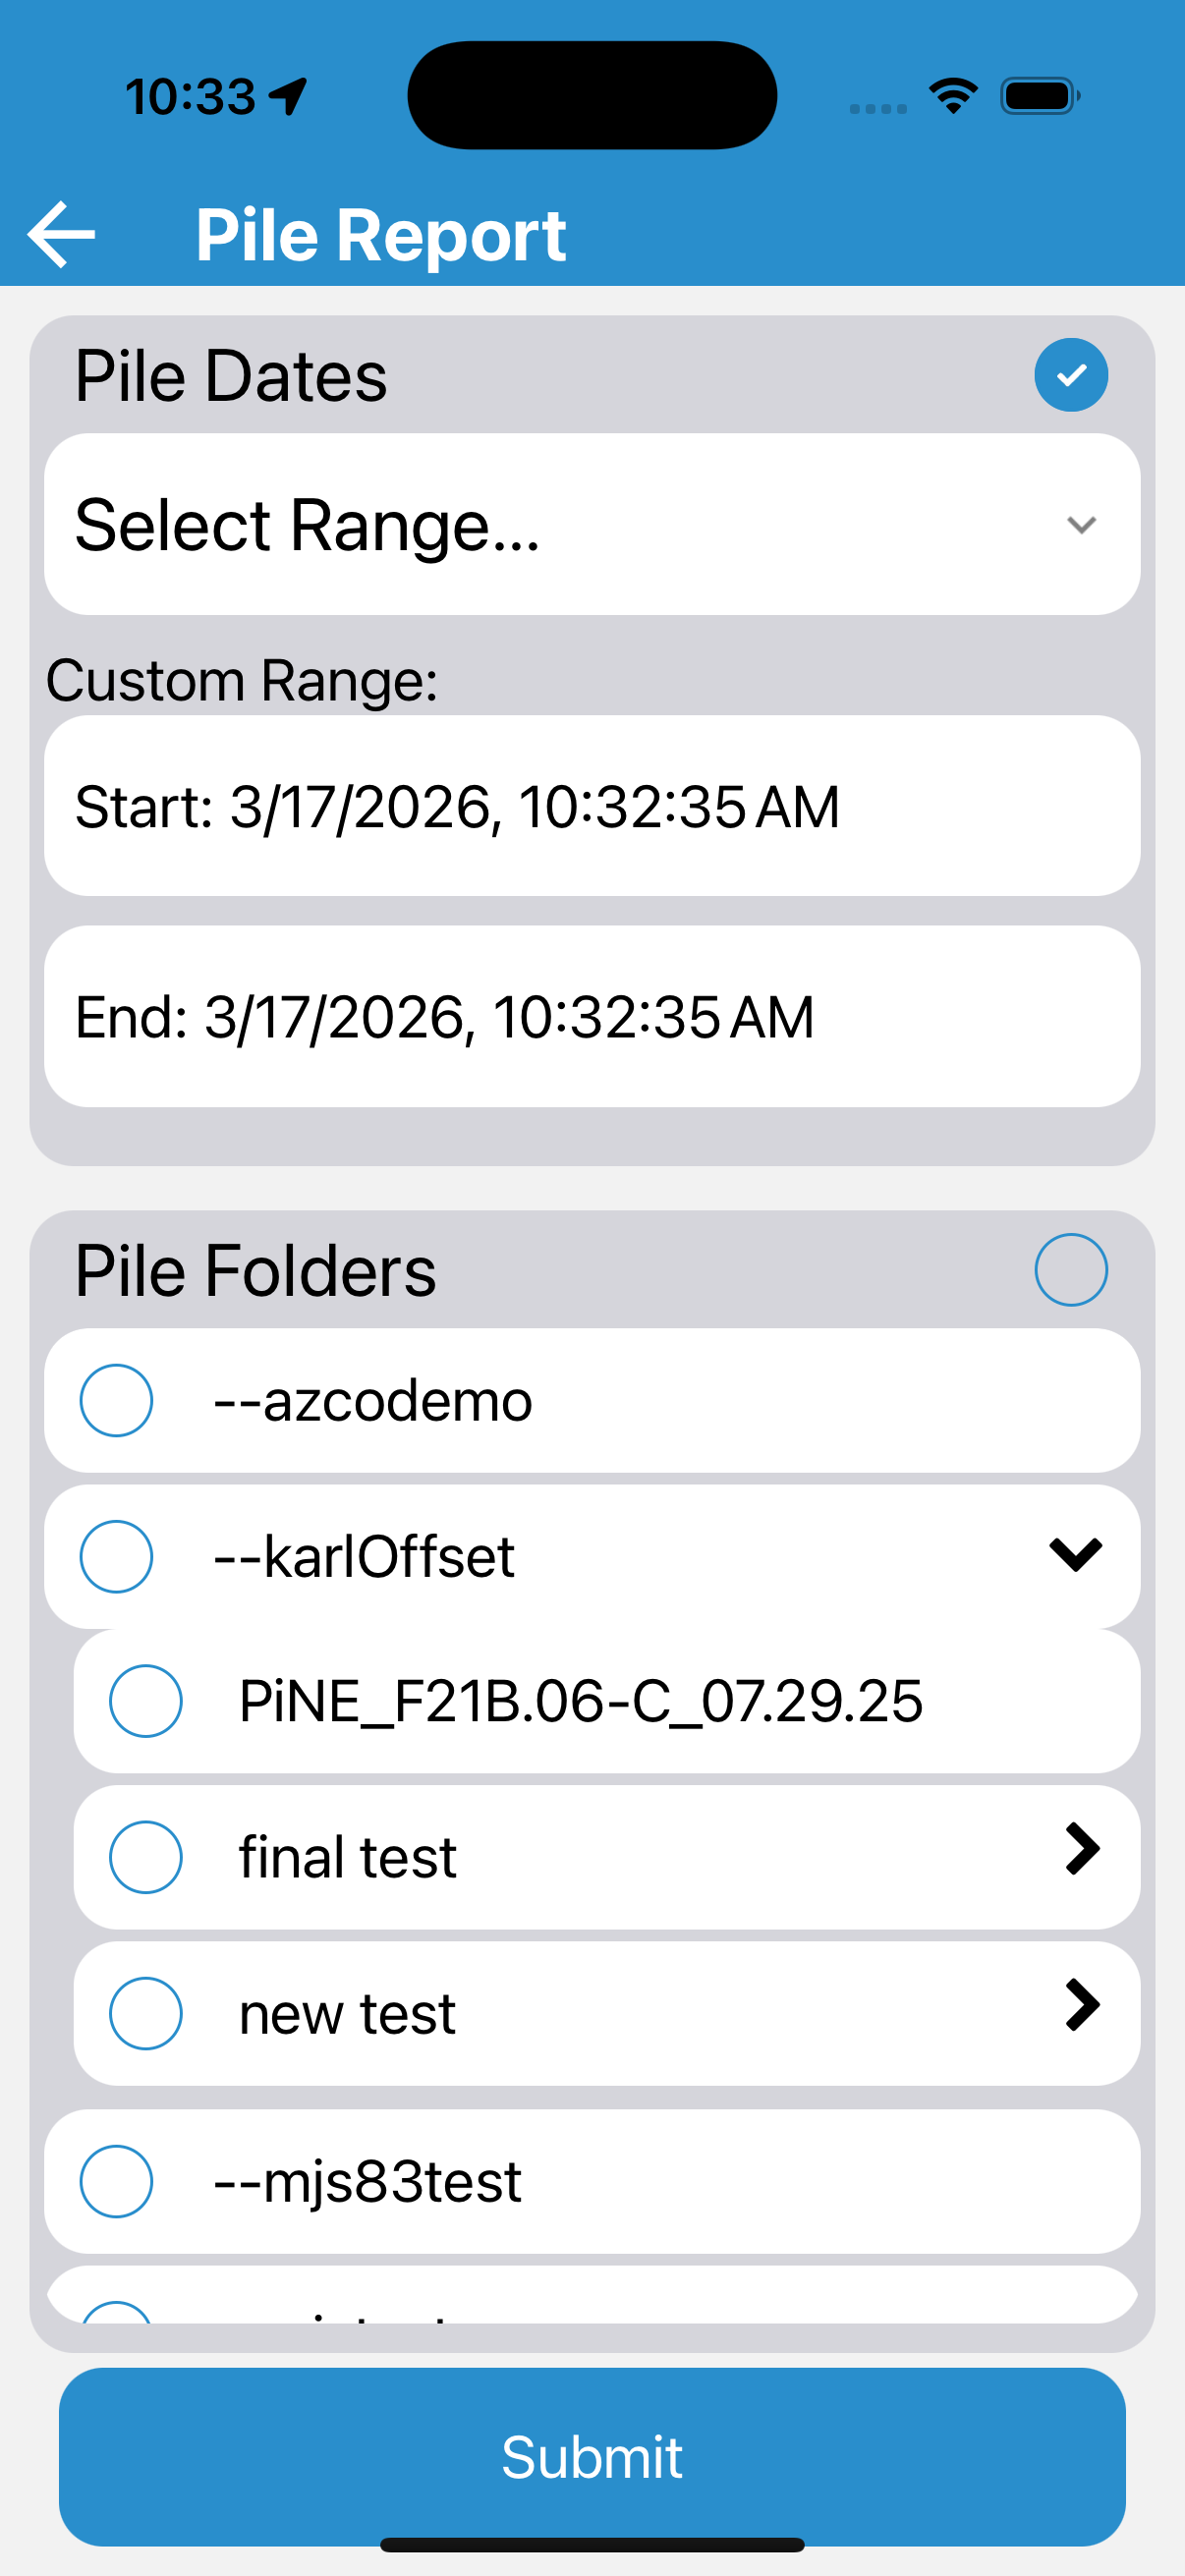
Tapping the Pile Dates checkbox allows you to select a pre fabricated date range or enter a custom range
- Prefabricated date ranges:
- Today
- Yesterday
- Current Week
- Monday - Sunday
- Current Month
- 1st of month - Today
- Previous Month
- Last 31 Days
- Custom Range: Input a custom date range.
Note: The Start date must be before the End date.
- Pile Folders: Select one or more folders to load piles from. Selecting a parent folder selects all child folders.
Note: Folders can be tapped to expand them and see their contents.
- Submit: Submits the selected date range and/or folders to draw relevant piles on the map.
Piles Drawn on Map
Pile layouts will vary depending on site configuration, date selection, folder selection etc.
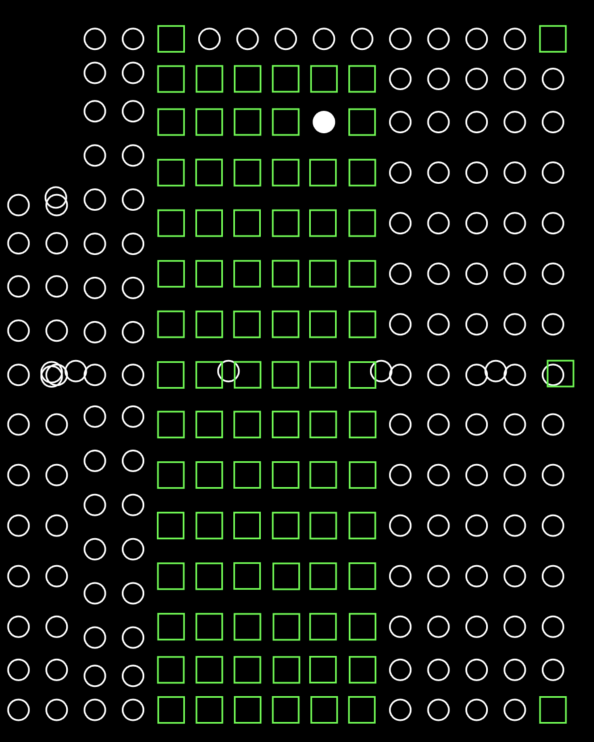
Tapping a pile will display a pile report. Example pictured below.
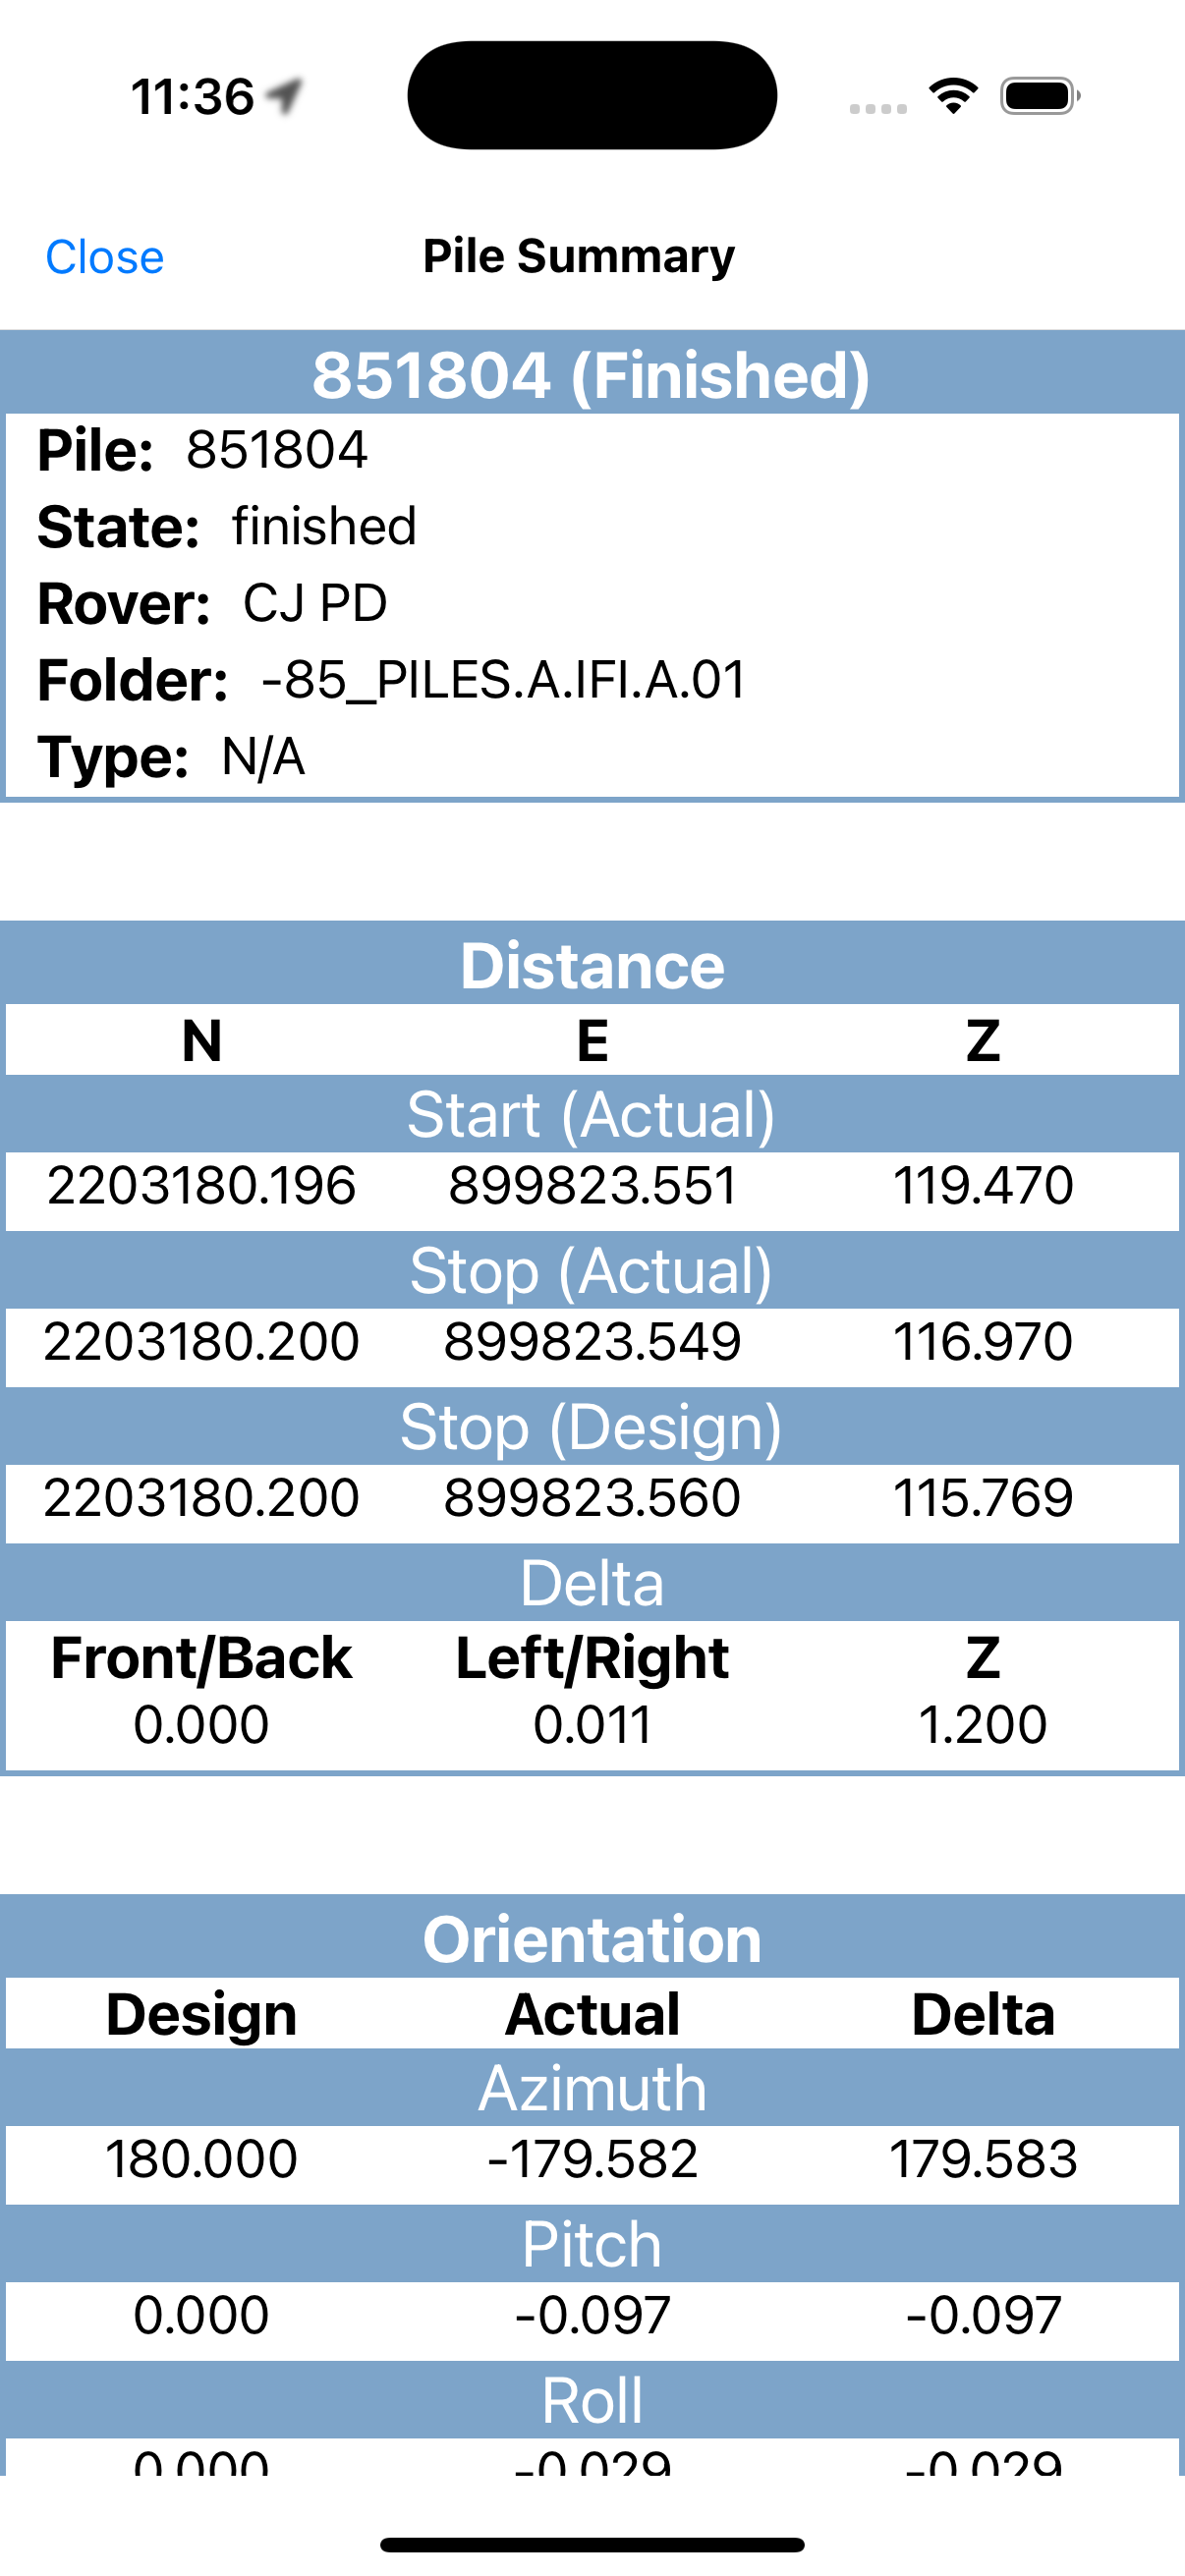
At the bottom of the Pile Summary is a list of notes for the pile.

- Tapping the “plus” icon will display the add pile note view.
- Tapping the section itself will show or hide the list of notes.
Add Pile Note
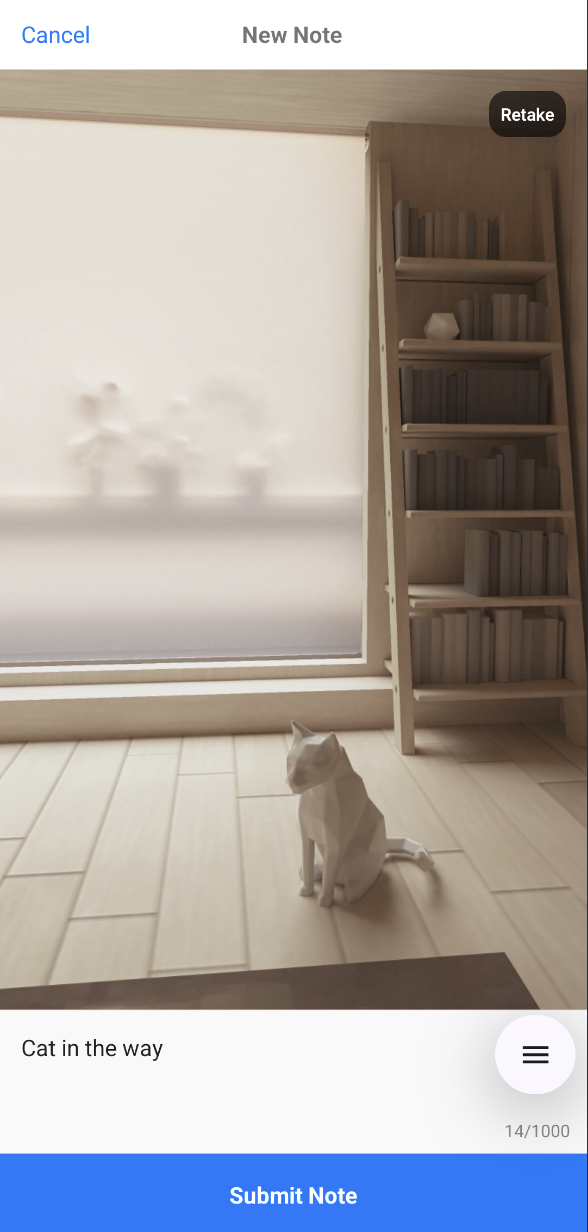
- Tapping the shutter button will take a picture that will be submitted with the pile note.
- Text can be entered will be submitted with the pile note.
- Tapping the retake button will remove the picture and allow you to take another.
- Tapping submit will submit the pile note. A note must contain text, image, or both.