Grid to Grid
The Grid to Grid report compares two grid surfaces (.grd) and produces volume and other metrics. This report is a port of a report found in Carlson Civil, Survey, Construction and Mining products.
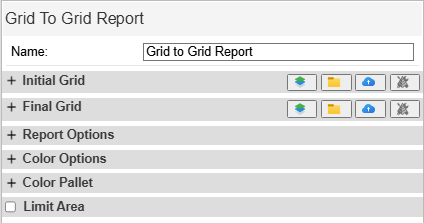
Grid to Grid Report
Options
- Initial Grid: The base or starting surface. All volume calculations are relative to this grid.
- Final Grid: The surface to compare to the initial grid.
- Grid selection:
 Enter a pad elevation.
 Select a .GRD file from a drive.
 Select a .GRD or .BGRD from Command.
 Select a date of a Protools surface to use. This selects a snapshot surface from a date in time as updated by the positions of the machines.
Volume Type
Select what to show in the map view color map.
- Cut/Fill to Design: Both cut(red) and fill (blue).
- Fill To Design: Fill (blue) only.
- Cut To Design: Cut (red) only.
Color Options
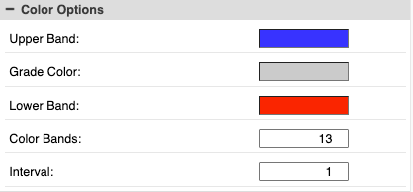
Grid Color Options
- Upper Band: The color for the highest elevation. This represents a fill between the grids.
- Grade Color: The color for no change between the grids.
- Lower Band: The color for the lowest elevation. This represents a cut between the grids.
- Color Bands: number of total steps between the highest and lowest elevations.
- Interval: unit distance between each step of Color Bands.
Color Pallet
This shows the legend for colors as configured. Click on the colors to change the color of individual bands.
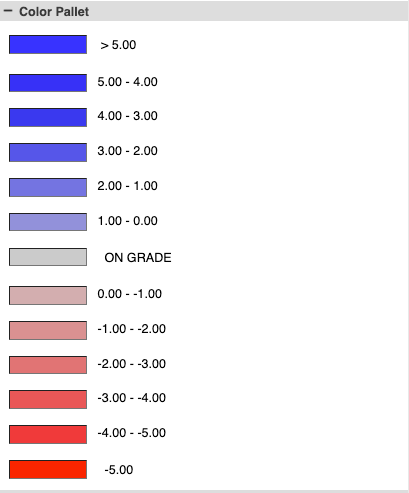
Grid Color Pallet
Limit Area
Select this option to draw a polygon. Metrics for the enclosed area are displayed in the Polygon section of the output.

Grid Limit Area
Controls
- Submit: run the report.
- Apply Boundary: After the report is submitted, press this to limit the area and add additional polygon metrics to the output.
Output
The map view displays a cut/fill color map of the difference between the two surfaces:
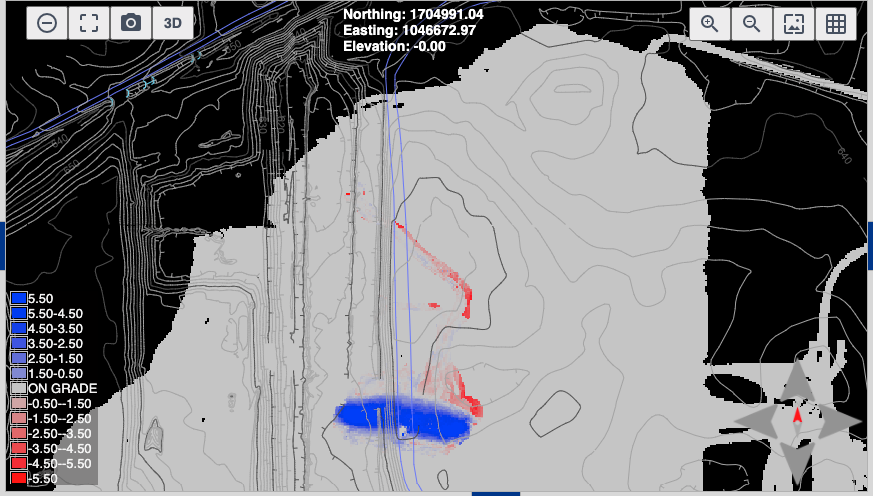
Cut/Fill Color Map
Results of "Limit Area" on map view:
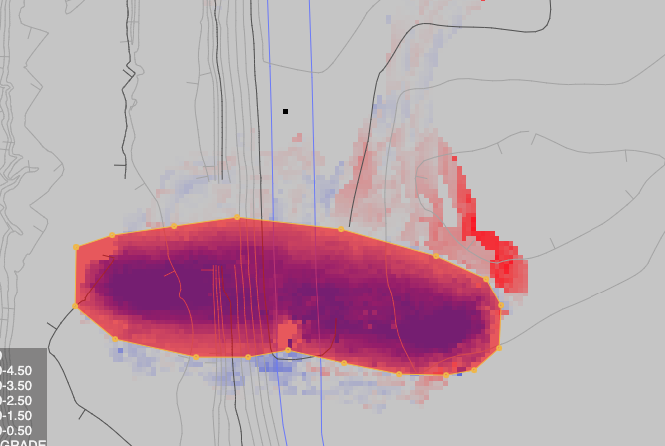
Cut/Fill Color Map (Area Limited)
The data is in the "Volume Metrics" tab in the bottom panel. Press "Apply Boundary" in "Controls" to display the values limited by the polygon drawn in "Limit Area."
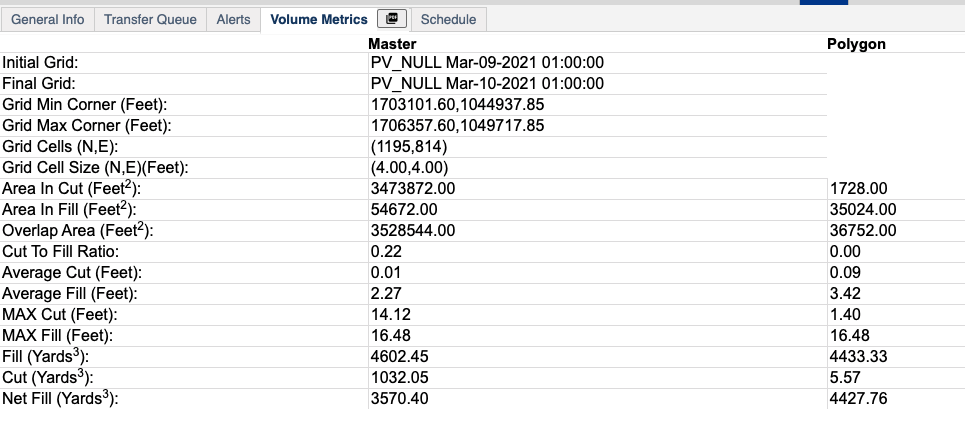
Grid to Grid (Table)
- Initial/Final Grids: The grids selected to compare.
- Grid Min/Max Corner: Coordinates of the corners of the compare grid.
- Grid Cells (N,E): Number of rows and columns of nodes in the compare grid.
- Area In Cut/Fill: The total area calculated for cut and fill.
- Overlap Area: Area that overlaps between the Initial and Final grid.
- Cut to Fill Ratio: Ratio of cut volume to fill volume.
- Average Cut/Fill: Average units of cut or fill per grid node.
- MAX Cut/Fill: Maximum units of cut or fill in the compare grid.
- Fill/Cut: The total volume of cut or fill in the compare grid.
- Net Cut/Fill: The volume difference between cut and fill. This is labeled based on whether the comparison is net cut or net fill.
Press the PDF button on the tab to download a pdf version of the report:
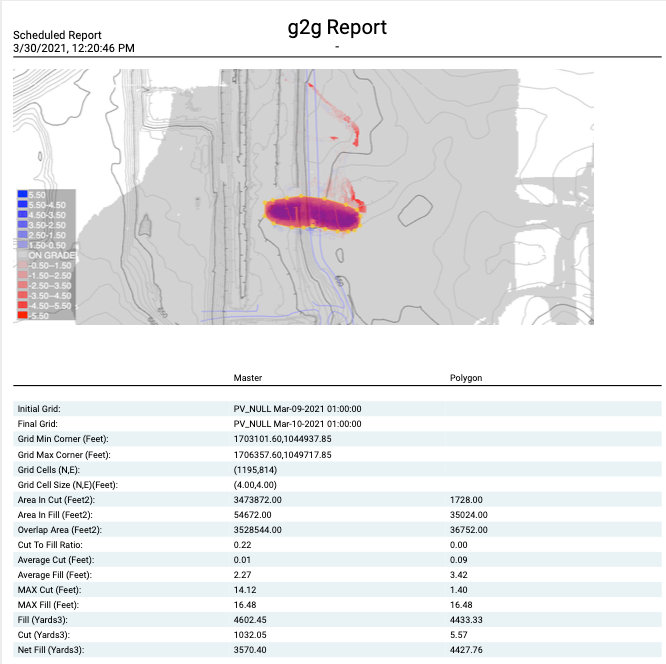
Grid to Grid (PDF)