Density/AUF Report
Overview
The following metrics are reported:
- Total Fill (CY/CM): The total volume of airspace filled during the selected time period.
- Total Area (sqFt/M): The area of the work zone or working face.
- Cover Volume (CY/CM): The required volume of cover material to cover the working face at the specified depth.
- Avg Fill Depth (Ft/M): The average depth of waste placed over the working face.
- Max Fill Depth (Ft/M): The greatest depth of fill placed over the working face.
- Weight (T/MT): The weight of material brought over the scales during the selected time period (user-input value).
- AUF (T/CY - MT/CM): The Airspace Utilization Factor, typically displayed as a percentage of Tons per cubic yard or cubic meter.
- Density (lb/CY): The density metric displayed in pounds per cubic yard.
- Density (lb/CFt): The density metric displayed in pounds per cubic foot.
- Upper Left (N,E)/Bottom Right (N,E): The northing and easting coordinates defining the corners of the limits for the AUF area.
Settings
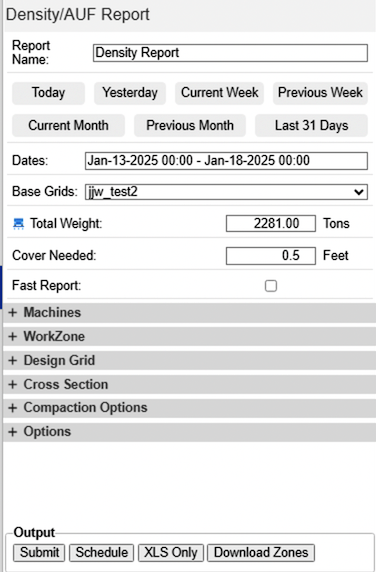
Dates – Specify the start and end date and time for the desired report.
Base Grids – If multiple grids are active in Protools, you must select the appropriate grid for generating this report. Typically, a landfill operation will be associated with only a single base grid.
Total Weight – This value represents the total weight, in Tons, recorded by the scales for the duration of the report. This number is automatically populated with the aggregate tonnage from the specified time period, whether the scale weights were entered into Command's Scale Weights manually or automatically.
Cover Needed - This setting specifies the required depth of cover material for the working face. The program uses this depth to calculate the volume of material needed for cover over the report period. Note that this calculated cover volume does not factor into the density calculation.
Fast Report - The Fast Report streamlines reporting for extended time periods. By clicking this button, the selected dates are simplified to whole days. The report then calculates the total volume using a grid-to-grid volume calculation based on the base grids. This approach significantly reduces the processing time required for longer periods. Consequently, a Fast Report cannot filter updates by machine; it will include all machines with a "Surface Update Type" of Cut/Fill or Cut Only (as defined in Machine Properties and Fleet Management -> Machines).
Troubleshooting Low or High Density Readings
If your density report shows unexpectedly low or high values, the issue often stems from inaccurate input data.
Key Diagnostic Steps:
Common Causes of Bad Data and Solutions:
Cause: Machine Elevation Bust
Tell-Tale Signs: Streaks of ground that are noticeably higher or lower than the surrounding areas.
Solution: Machine calibration and bad data removal. Contact support for assistance.
Cause: Gaps in Data
Tell-Tale Signs: Cliff-like fills on and around the working face. This occurs when machines operate for extended periods without data capture, crediting volume to the report timeframe that was filled earlier.
Solution: Restart Protools with a clean slate: Use a new Fly-over surface or a fresh null grid. Contact support for assistance.
Cause: Untracked Equipment
Tell-Tale Signs: All machines placing waste during the report period must be equipped with Carlson Landfill Grade and have the system in working order. If some machines are not tracked, it will skew the working face model and data accuracy.
Solution: Ensure all equipment on the working face is tracked by Carlson Landfill Grade.