Output
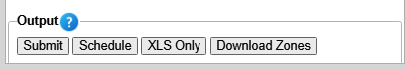
Press Submit to run the report. It may take a moment to complete all calculations.
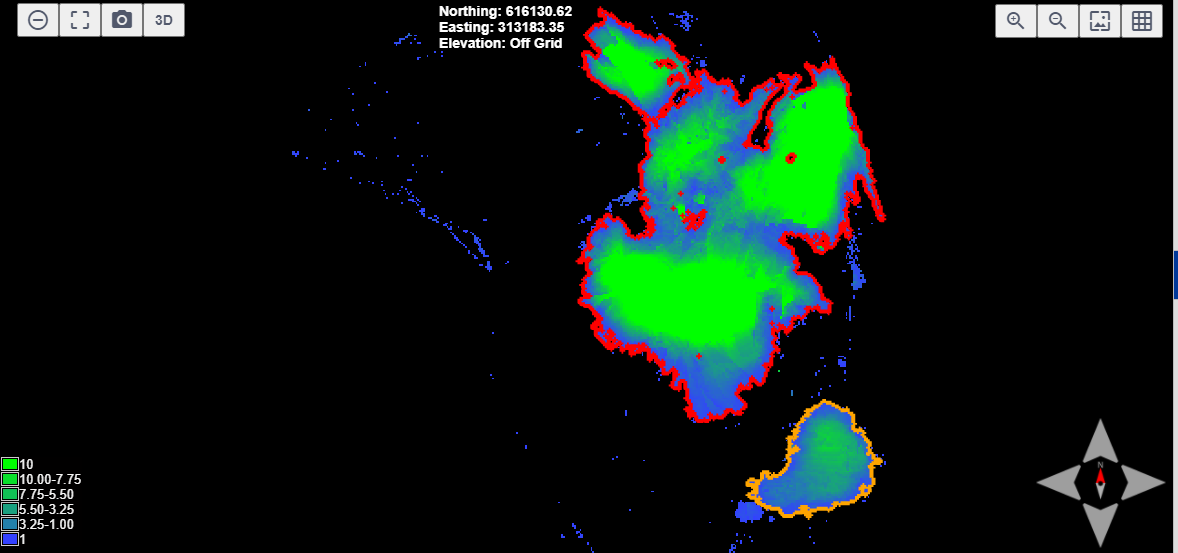
In the plan view, Work Zones will be displayed using the colors configured for "total fill" in the AUF setup. To make each zone distinct, they will be outlined with different colors.
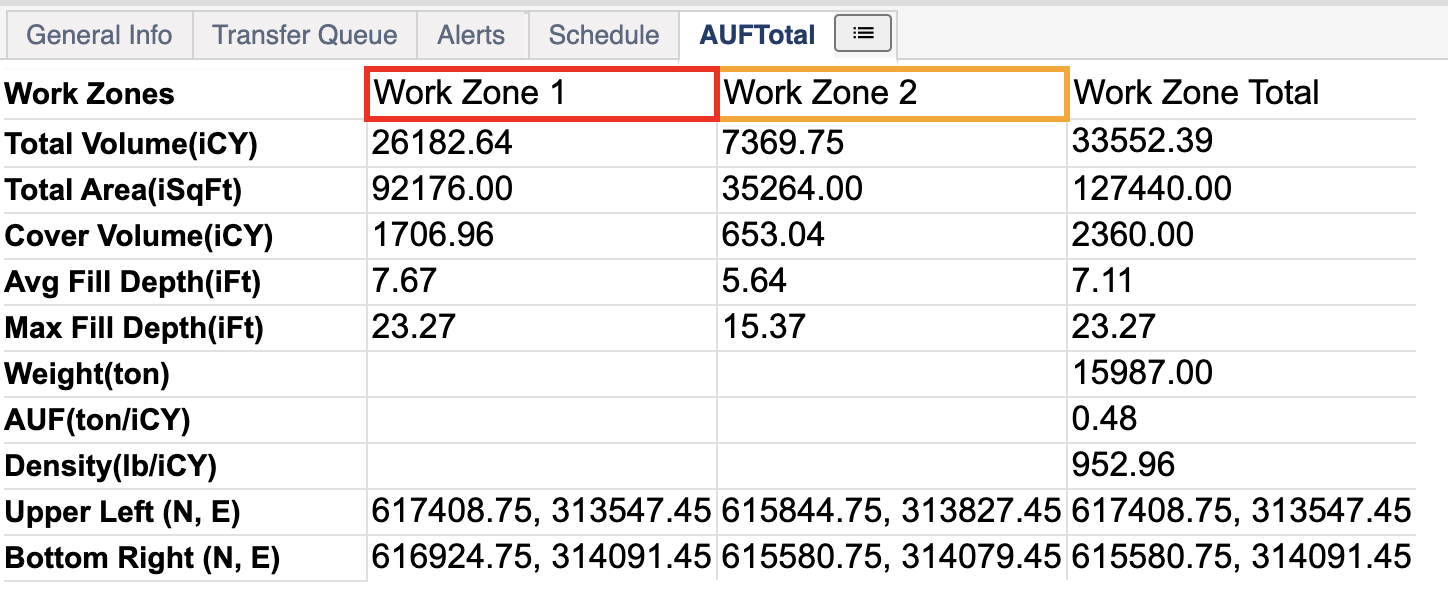
The calculated data is displayed in a table located in the details panel at the bottom. Each work zone is represented by a color that corresponds to its work zone number. For each work zone, the table presents the total volume, total area, cover volume, average fill depth, and maximum fill depth. The "Total" column on the far right summarizes these metrics for the entire time period, in addition to showing the overall density.
Schedule - Open the Density Report scheduling menu.
XLS Only - Download an XLS version of the report without any map output.
Download Zones - Download the Work Zone outlines as a CSV polyline file.