Carlson Command is a Cloud-based platform for managing heavy equipment, connecting office & field by sending project data (designs, surfaces) to machines and receiving real-time progress (cut/fill, location, status) for improved efficiency, safety, and accuracy in construction, mining, and landfill operations. It provides remote oversight, monitoring, and communication, allowing managers to see machine positions, check progress on color-coded maps, and send messages to operators from anywhere.
This section explains how the Header menus are grouped and provides a basic description of each item in the menu.
Command Header Menu
Command
The Command page is the control center of the program, and where the site map is found. There are also several reporting and historical informational tools available from this dropdown. Clicking this section will open a pulldown menu only while on the Command page. If not on the command page, this button will return to the Command page from other sections of the software and will not show a menu.
Command Routines
Project Loader: Menu for loading an existing Grade project into Command for line work and surface views. This feature is handy for loading groups of files together.
Plan View Files: Available line work maps. Display or hide Line work from this menu.
Surfaces: View the Cut/Fill color map, design, existing and other surfaces.
Historical Data: View machines in real time and historical playback.
Map Properties: Controls for the map view.
Map Tools: Measurement and data manipulation tools for the plan view.
Block Models: Set up viewing material types in the Map View from Carlson Block Models here.
Design: Create usable files and structures for use in Command and Grade.
Warning/Watch: Opens the warning/watch zone creator.
Polygon: Opens the menu for creating and editing polygons for polygon events.
Reporting
Reporting Routines
View industry specific reports on the Command Page. These reports will be detailed in later sections and common reports are:
File Transfer: Links to the file transfer page where files and projects are sent to the machines.
Grade Projects: Compile engineering files into Projects for use in Carlson Grade.
Fleet Management:.
Fleets/Machines: Create or edit fleet definitions, and rovers/machines.
Operators: Create, or edit the list of operators for Carlson Grade.
Operational Codes: Create or edit the operational code lists (Activities, delays and down codes).
Grade Configuration: Manage the settings files for machines running Carlson Grade v8.0 or later.
Pile Utilities: (Pile Module Only) Tool to manage and import pile designs.
Drill Utilities: (Drill Module Only) Tool to manage Drill shots and holes.
File Utilities:Access all of the Command and Grade files uploaded into Command.
Protools: (Productivity Tools) Maintains as-built surfaces based on the rover's position.
Data Editor: View and edit event data from the Machines.
Manual Data Entry:Enter machine time events manually
Manuals: Location of Carlson or User created help.
TimeLine:View machine time events on a visual timeline.
Icon Links
Icon Links 1Icon Links 2
Command Map Page
The Command map page is the hub of Carlson Command for monitoring machines, viewing surfaces, and running reports.
Fleet Explorer
Fleet Explorer
Fleets
The Fleet Explorer panel gives a quick overview of the fleets and their current status. To the left of the name of each rover is an icon that indicates the current state of the machine.
A Gray icon indicates that the machine is not communicating with the office.
A Green icon indicates that the machine is communicating with the office, and is not in any elevated state.
A Yellow icon indicates that the machine was communicating but has recently stopped. If a connection is not established within 15 seconds, the icon will turn red.
The Alert icon indicates that the machine has an operational error. Check the alerts tab below to find out what alert code was signaled from the machine.
The Gear icon indicates that the machine has been placed in a down state. Down codes are covered under Fleet Management → Manage Operational Codes.
The Clock icon means that the data coming in is older than server time. This can happen if the machine was offline and is now catching up, or if the clock on the machine is behind the server clock.
The Red Clock indicates that the data streaming in is ahead of the server time. This means the clock in the machine is wrong and should be fixed immediately. This usually occurs when the system clock in the machine gets a bad date from the GPS.
The Green Lock indicates two machines are streaming in as the same machine name. One machine's hardware ID matches the database for this machine and the other does not.
The Red Lock means a machine with the wrong hardware ID is attempting to stream in but is locked out. A machine with the correct hardware ID is not currently streaming.
The Monitors Icon means the Command Agent remote screen viewer is connected; however, Carlson Grade is not running on the control box. This indicates that there is network connectivity and the control box is powered on.
Note: Check the Alerts tab to see the locked out machine IP address and hardware ID.
Machine Right-click/Context Menu
Right-click (Context) Menu
Click to select an individual rover or group of rovers. Click on the machine or fleet to highlight it. While highlighted, the selection will limit what is seen in the Map View, and the Details panel, as well as any reporting.
Right click the rover to bring up a context menu.
Properties: Open the properties menu for this machine.
Import Grade Files: Allows the manual import of log files from the machines (see below).
View Project: Open the currently running grade project in Command project viewer.
Timeline: Open a timeline for this machine in the bottom panel.
Zoom to Machine: centers the map view around the rover.
Dashboard: Open the dashboard for this machine in the bottom panel.
View Screen: Opens Carlson Command Agent for remote viewing the screen of the machine.
File Browser: View and import files from the machine's drive.
Instant Message: Send messages to the Machine to communicate with the operator in real time.
Remote Support:Use a third parting remote viewing application.
Properties
The Machine Properties selection opens the menu shown above. The Fleet, Machine Type, and Surface Update Type, and Trace Color properties are editable from this menu. The Machine Properties table on the left contains all known information, as it is collected, from the Carlson Grade software. Below the machine graphic are four tabs:
Up Time: A quick Up/Run/Idle/GPS Down time report from the last 12 hrs.
Notes: Quick notes on the machine.
Past Notes: Collection of previously taken notes.
Documents: Upload any important documents pertaining to this machine.
Import Log Files
Logs are normally streamed into Command over a wireless network and nothing is backed up on the machine. When the machine loses network connectivity, a backup file is created in the C:\data\logs\ folder. Logs can be manually transferred from the machine to Command via USB drive for a few possible reasons:
No or weak network connectivity on the machine.
A control box is replaced and the files on the old control box need to be imported.
File Utilities
These logs have the extension .SMCBACK. They are copied from the machine to a USB drive using the Backup Streaming Logs button in Grade.
Backup Destination Drive
Select the drive to back up the logs to. The logs are copied into [drive_letter]\LOGS\[site_name]\[machine_name].
SMCBack Files
Click the Import Log Files selection in the context menu for the machine to import the logs for. Click Choose Files, and select the files from the USB drive or another location.
Note: Multiple files can be selected.
Confirm the log files match the machine name at the bottom of the import screen (Failure to ensure proper machine will result in corrupted data). Press Yes and a wait dialog will appear. Once the logs are uploaded and parsed into the Command database a green confirmation will appear to indicate the logs have been uploaded successfully.
View Project
View Project
Selecting View Project from the machine's right click menu opens the Project Loader See the details panel for the project currently loaded on the machine.
Timeline
Machine Timeline
The timeline shows the activity of the machine over the last 12 hrs.
The top line is:
Run time: Green.
Idle Time: Yellow.
GPS Downtime: Red.
Grade Off: Gray.
Alerts are shown as start and end time marked with Xs.
Moving Timeline
Clicking on a section of the timeline will tell you the start and end time of the color selected.
Below the timeline are:
Operator
Project
Activity
Zoom To Machine
Move the camera to the machine in the plan or 3D view.
Dashboard
This opens a dashboard tab in the Details panel at the bottom of the screen. The new tab is labeled with the selected machine. The Dashboard tab provides a near real time overview of several key metrics including Average Speed, Distance, Idle Time, Run Time, Current Speed, and other rover specific metrics.
Machine Dashboard
Each gauge shows a metric total or average for the time selected.
The Gear icon found in the upper left corner of the Dashboard tab opens settings for the Dashboard.
Dashboard Settings
Choose between:
Fixed Time: Calculate the dashboard metrics starting from a specific time of day.
Fixed Duration: Calculate the dashboard metrics using a fixed number of hours.
Press the Unlock Gauges button to enable the movement of gauges. Once finished rearranging press the button again to Lock the Gauges in place.
View Screen
View Screen
Carlson Command Agent provides remote access to any online machine from within Command.
Refresh
Rotate
Send Ctrl-Alt-Del
Open Clipboard
Settings
Settings Location
Disconnect
Settings for Carlson Command Agent can be found in the Settings menu located in the toolbar.
File Browser (machine)
Machine File Browser
File Browser allows the download or import of files directly from Grade. The Data directory from Grade is available for browsing.
Right-click on a file to open a context menu. From there, select Download to download the file to the local computer. Select Import to import the file into Command.
Use the Search input at the bottom to search the files.
Instant Message
Use Instant Message to send direct messages to the operator of the Carlson Grade equipped machines. Operators may respond based on the reply type selected.
Instant Message
Use the drop down to select the type of response from Grade.
The Operator is prompted with the message and the option to respond.
OK: Presents the message with just an OK button for response:
Instant Message OK
Yes/No: Presents the message with only those two choices:
Instant Message Yes/No
Keyboard: Presents the message and opens the keyboard so the operator can type their response:
Instant Message Keyboard
There are four unique colors that represent message states:
Yellow: Message being sent to Grade.
Green: Message sent to Grade.
Red: Message failed to deliver.
Blue: Response from Grade.
If a message is clicked, the resulting corresponding message/response is highlighted.
Message/Reply Selected
Scene
The Scene Explorer shows all of the files that are currently loaded into the map view, and has a toggle for quick reports. The "Reports" section shows quick reports for the last 12 hours.
Scene tab
Control Point: Show the control points from the default localization on the map.
Plan View Files: Shows the plan view files currently loaded into the map and allows the user to toggle on/off.
Reports - Today: Plot on the map reports from the last 12 hours.
GPS Status: Heat map of locations with GPS down time (Float/Stand alone/Autonomous/bad sensor).
GPS Scene Report
Machine Traces: Plot on the map the last 12 hours of machine positions colored according to color configured for this machine.
Surfaces: Shows the currently loaded surfaces on the map.
Users
The Users tab shows users who have connected to the site on the Command Mobile app. Their locations are toggled on the map with the checkbox.
Users tab
Sites
(Command Center Users only)
If the user has access to multiple sites, they appear in the Sites tab of the Fleet Explorer. Sites are organized by industry, if applicable. Right-click on a site and select "Switch" to jump to that Site in Command.
Sites tab
Details
The Details Panel at the bottom of the page provides additional information about each machine.
Details Panel
Any data from a report run on the Surface Map Page appears here. Adjust the height of the Details pane by click-dragging the edge, and hide and show by clicking the blue button on the top center of the edge. It is separated into four tabs:
General Info: The General Info tab has all of the details of the current status of the machine. The list can be sorted by column by clicking on the column name.
More Information
Machine: The name of the rover or machine.
Activity: The activity entered into Grade, if applicable.
Type: Vehicle type, such as Dozer, Excavator, Compactor, etc.
Fleet: the Fleet to which the machine is assigned.
Operator: The operator logged into the machine, if applicable.
Last Contact: The time of the last position sent from the rover.
N: Northing.
E: Easting.
Z: Elevation.
°: Azimuth (direction of travel).
Design: The elevation of the design at the current position of the machine.
Cut/Fill: Distance in elevation to the design at the current position of the machine.
Project: The Grade Project currently loaded on the machine.
Press the Settings button in the upper right corner to open a menu for the details panel. Toggle the visible columns under "General Info." Change the default sort column and the default sort direction.
Settings ButtonSettings Details
Transfer Queue: The Transfer Queue tab shows a historical log of all file transfers that have been initiated through the File Transfer menu in Command.
See the File Transfer section for more info on sending files.
More InformationTransfer Queue
Controls
Search Transfers: Enter a search string and the rows of the table will be limited to rows that contain the search string. Examples might include: "complete", "timed out", "Dozer2" etc.
Limit Queue: This will limit the number of transfers shown. Options are:
Last Month (default)
Last Week
Last Day
All
Columns
Machine: The name of the machine.
File: The file that was transferred to the rover.
Start Time: The time the transfer was initiated.
Stop Time: The time the transfer was completed.
Status: The status of the file transfer. This will display queued, and completed transfers, or reason for failure.
Alerts: Command reports Alerts that have been signaled by Carlson Grade on the Rovers. Alerts are any status in Grade that causes the status bar to flash Red to the operator. Alerts may be problems with communication to positioning sensors such as:
No Position Data: No connection to a GPS receiver.
Lost Lock:
Autonomous: No RTK corrections received.
Float: RTK corrections but no fixed position.
No Sensor Input: No connection to axial sensors.
No Sensor Data from Sensor (Sensor Name): The Sensor has gone offline.
Warning/Caution:
Proximity to another rover.
Inside a Warning or Watch area.
Above or below a warning surface.
Bad Hardware ID: A machine is attempting to stream as a machine with the wrong hardware ID. Details like IP address and hardware ID of the offender are included.
More InformationAlerts
Machine: The name of the machine.
Start Time: The time the alert began.
Stop Time: The time the alert ended.
Message: The alert message.
Clear: Allows the user to manually clear the alert.
Note: The Alerts tab will only show the 'active' alerts, or alerts that are currently happening while all machines are selected in the Fleet Explorer. Select only some machines to see historical alerts, This will be limited to the last 100 alerts.
Schedule:
This tab displays the scheduled reports for the site and for the user.
Site Reports
These are reports scheduled for the currently loaded site.
Type - The kind of report
Name - The custom name of the report
Recipients - The users that receive the reports
Frequency - how often the report is sent
Send Time - The day/time the report is sent
Last Run - The last time the report was sent.
Delete - Remove the report from the schedule.
User reports
These are any reports the user is subscribed to regardless of which site is currently loaded.
Press the Delete button at the end of a row to remove the report from the user.
Command Map View
The Command Map provides a live or historic overview of the site. Select one or more line work files to display. Machines update in near real time. Enable the Satellite view to overlay the line work on a satellite image.
Map View - Drilling ExampleMap View - Solar ExampleMap View - Landfill Example
Control Overview
Map Top Row
The top row of the Command Map has some basic controls, as well as info about the map at the location of the cursor.
Map View Top Controls
Clear: Removes any extra layers such as reporting elements or legends from the map.
Machine Icon View: Turn machines on/off in the map.
3D: Enables 3D mode for viewing the site and surfaces in 3D.
Cross-Section: Select two points to get a cross-section view of the surface.
More InformationMap View - Cross-section
Load a surface. This can be a design, the Protools existing surface, or a historical surface.
Press the Cross section button in the controls.
Right click 2 points anywhere on the surface to draw a cross section line.
A tab opens in the Detail panel at the bottom with the cross section view.
Screen-Capture: Download a .PNG format image file of the current mapview.
Zoom Controls: Zoom - and Zoom + will Zoom in and out respectively. Alternatively, use the scroll wheel of the mouse to control the zoom level.
Zoom Extents: Repositions the Surface Map to focus on the center of loaded files.
Map Options: Drop down of possible map backgrounds.
More Information
Satellite image.
Roads.
Hybrid.
Weather Options: Drop down of possible weather overlays.
More Information
Rain.
Wind.
Clouds.
Map Side
The left side top column of buttons are quick links to menu items:
Map View Side Buttons
Linework
Surfaces
Historical data
Project Loader
Map Tools
Polygon Events Design
Warning/Watch Design
Toggle Axis helpers
Map Properties
3D Command Map
View the map in 3D by clicking the 3D button in the surface map control bar. Select a surface to be displayed from the Surface menu, otherwise only the line work will be displayed instead of a 3D surface. The machines and their surface updates also show in 3D. These can be seen by having the surface type open in 2D and then switching to 3D, or by opening the 3D model and selecting the surface type from Command → Surfaces.
3D View types
Cut/Fill Color Map: If this is selected from surfaces the cut/fill colors will be overlaid on the 3D surface model. Live Rovers will update the cut fill colors with progressive cut/fill colors.
3D View - Cut/Fill Example
Current Surface: If this is selected the 3D surface model will start off as a gray color. The live rovers will update the model with progressive cut fill colors (blue for fill, red for cut and gray if no change). If the Satellite button is pressed the surface will be overlaid with the satellite imagery (if available).
3D View - Current Surface Example
Design Surface: This will display a static model of the design surface selected.
3D View - Design Surface Example
Initial Surface: This will display the surface in its starting condition. If the surface was created from external topography data, that original surface will be displayed. If the surface starts from a null (or blank) grid, then it will display the first pass of machines at each location.
3D Controls
The controls for 3D mode vary slightly from the standard 2D mode.
Zooming: Use the scroll wheel on the mouse to zoom in and out.
Central/Main Point of Focus: The main point of focus on the map will be a 3D axis icon (shown to the right). This is seen in the image below the 3D axis icon. The main point of focus is the central point of rotation when rotating in 3D mode. Shift the point of focus by right clicking and moving to the desired point of focus.
3D Axis Helper
Rotation/Changing View Angle: Change the current viewing angle by left clicking and moving the mouse to the desired angle.
Clear: The clear button will reset the view to its original state.
Focus on a particular machine by right clicking on the rover name from the Fleet Explorer and then selecting "Zoom to Rover". This will keep the camera focused on this machine and closely follow its movements. To stop following the rover hit the Clear button.
3D Box: The 3D box serves two purposes
Give the user a clear illustration of the current perspective.
Provide a control and snap to perspective.
Click and hold to drag the perspective using the box, or click on the sides to snap to a perspective, such as top down.
3D Box Control
Slider Bar: This clips the objects in the perspective from the camera direction (bottom slider), or opposite the camera direction (top slider).
Lock: Click this to lock the perspective from changing. Panning and zooming will still be available. Click the lock again to free the controls.
Locked View
Command Pull Down Menu
As discussed earlier in the overview, the Command pulldown menu is the working hub of Carlson Command. All of the monitoring and historical analysis can be found here.
Line Work
Easily show and hide available line work maps on the Surface Map by selecting them in the Line Work menu. Select at least one line work file in order to view the machines on the Surface Map. Press "Import" to load in new line work files. Command uses a converted drawing format to display line work. All line work imported will be converted. If there are issues importing a line work file, please send the file to Technical Support.
Show/Hide Line Work
Note: Layers can be switched on and off in the section below. Both the Line Work Files and Layers Sections can be collapsed for easier viewing.
Surfaces
Choose what and how surfaces are displayed on the Surface Map. For 2D this refers mostly to what color map is loaded. For 3D this refers to what 3D surface is displayed, as well as if any colors are used. All surfaces shown in this menu will be converted from the original format to a Carlson .BGRD format. This stands for "binary grid" and is an efficient and optimized version of a grid file that can be updated quickly "on-the-fly."
Surface Selection
Surface Export
Every menu for surfaces has a section called Surface Export. Use this feature to export a small section from a surface loaded into the 2D map.
Choose Surface
Select from line work: Select a polygon in the line work to limit the surface by area for export.
Free Hand: draw a polygon to limit the surface by area for export.
Left click the free hand selector.
Click the Green check icon to close the polygon.
Download the smaller surface as an XYZ text points file or a Carlson GRD file.
Actions
Convert
Import a digital terrain model (DTM) to display and use in Carlson Command.
Accepted formats:
DWG/DXF: A dwg containing a surface made of 3D faces. This surface must be made of individual 3D faces and not an AutoCAD or other surface entity. Make sure the 3D faces are turned ON. Refer to the guide C3D Surface to 3D Faces.pdf found in the documentation section of the downloads on hd.carlsoncommand.com.
TIN: Carlson tin format.
GRD: Carlson grid format.
GPT: Carlson Grade point file.
CSV: A comma separated list of points.
XML: A surface in a LandXML file.
BGRD/BTIN: Carlson binary surface formats.
Convert Options
Import as .TIN: (Display only) Importing a DTM as a tin will make it display only. It cannot be used for surface updating in Protools. Used to preserve the triangles.
File: Select the file from a drive to convert and import.
Spacing: (Default 4ft or 1 meter) Set the grid spacing for the converted file. Grids are equally spaced points with elevations. The tighter the spacing, the larger the resulting file. A good rule for accurate machine update is ¼ the width of the cutting edge of the smallest heavy machines equipped with Carlson GPS.
Press Apply to convert and import the file.
Note: All imported surfaces will be stored under Design and are available for using Protools or Grade Projects.
Create
This feature will create a null grid for use in Carlson Protools.
Create Options
Spacing: The distance between the nodes of the grid.
Name: Name of the grid to be created.
Bottom Left/Top Right: Coordinates of the corners of the grid. Right click and drag in the map view to fill in these values by selecting the extents of the grid to be created.
Grid Limits
Save: Save the grid to the server for use in Command.
Download: Download an ASCII .grd file of the surface created.
Merge
Select two grid surfaces to merge. The merge process will update all grid nodes in the first surface with elevation data from the second. The resulting grid can be saved to the server or downloaded in the browser.
Merge Options
Output Grid Name: Name the file created as a result of the merge.
Initial Grid: Select base grid for the merge. The file button uploads from a drive and the cloud button opens the file browser to select an already uploaded file from Command.
Update Grid: Select an update grid to apply to the initial grid.
Fish Net
Create a surface snippet from machine movements over a period of time.
Fish Net Options
Dates: select dates of machine positions to create surface from.
Source: Select the area of the new surface from:
Grid: The bounds of an existing grid surface.
Draw: Draw a box on the map using the right click → drag method.
Max Extents: Use a box created from the machine traces over the selected dates.
Press Apply and the surface will generate and download through the browser.
Cut/Fill
The Cut/Fill Color map is a display of the existing surface created by Productivity Tools compared against a design surface. Often this is shown as:
Cut/Fill Color Map
green for "On Grade"
red for "Needs Cut"
blue for "Needs Fill"
It can also be displayed as progressive cut/fill from the inception of the initial surface. This might be:
gray for "no change"
red for "cut"
blue for "fill"
Note: This option can be used in 3D and 2D.
Start Surfaces: These are surfaces that are updated by Carlson Protools. These surfaces are configured under Tools → Protools → Run Protools and configuration is covered in the Protools section of the manual. Select any one initial surface at a time.
Designs: These are surfaces compared to the existing surface. They can be a final design or an intermediate design. The Cut/Fill color map will only appear in the mapview where the Initial and Design Grids overlap.
Deck/Slopes: Slopes function the same as Designs for the Cut/Fill feature. Slopes are created in Carlson Grade and are imported automatically by Command. Select a slope as an alternative to a design for the cut/fill comparison.
Color Options: Set the colors for the map and the interval at which they change. Press Add to add a new color band.
Cut/Fill Color Options
Live Surfaces
Current
These are the live surfaces as output by Productivity Tools. In 2D, this is displayed as a two color gradient, from lowest to highest elevation. In 3D, this is the 3D surface shown, and will start out as gray. Any live updates will be shown as progressive cuts (red) or fills (blue). Go to the Rovers menu and start a historical playback, the surface will be updated to the state of the surface at the beginning of the time period selected.
Live Surfaces (Current)
Starting Surfaces: These are surfaces that are updated by Carlson Protools. These surfaces are configured under Tools → Protools → Run Protools and configuration is covered in the Protools section of the manual. Select any one initial surface at a time.
Color Options: (2D only) Set the colors for the map and the interval at which they change.
Upper Band: This color indicates the highest elevation of the grid.
Lower Band: This color indicates the lowest elevation of the grid.
Historical
This feature displays the Protools surfaces as snapshots from past dates.
Live Surfaces (Historical)
Starting Surfaces: Select the base grid to display.
Color Options: (2D only) Set the colors for the map and the interval at which they change.
Upper Band: This color indicates the highest elevation of the grid.
Lower Band: This color indicates the lowest elevation of the grid.
Date/Time: Select the time of the grid to display.
Press Apply to load the grid into the map or the 3D view.
Deflection
This feature displays the last pass deflection of Protools surfaces. This is only the deflection for the current state of the surface, and does not convey any historical data.
Live Surfaces (Deflection)
Starting Surfaces: Select the base grid to display.
Color Options: (2D only) Set the colors for the map and the elevation at which they change.
First pass: Select the color the first pass over the grid should be. The colors indicate if the surface is deflecting.
Using red for the first pass would indicate that the surface is deflecting on the first pass.
Setting it green would indicate that it is not.
Positive fill: (default blue) This indicates that more fill has been put on because the surface went up by the threshold on the last pass. This would not be considered compacted.
No change: (default green) The surface did not deflect or get filled. This is the good or "complete" state.
Deflection: (default yellow, orange, red) These colors represent degrees of deflection. Because the surface is still deflecting it is not considered compacted or "complete."
Press Apply to load the grid into the map or the 3D view.
Design
In this mode, any surface file loaded into Command can be viewed as a two color gradient in 2D or as a static surface in 3D. This is for viewing and inspecting uploaded surfaces.
Design Surfaces
These are the live surfaces as output by Productivity Tools. In 2D, this is displayed as a two color gradient, from lowest to highest elevation. In 3D, this is the 3D surface shown, and will start out as gray. Any live updates will be shown as progressive cuts (red) or fills (blue). Go to the Rovers menu and start a historical playback, the surface will be updated to the state of the surface at the beginning of the time period selected.
Designs: These are surfaces compared to the existing surface. They can be a final design or an intermediate design.
Color Options: (2D only) Set the colors for the map and the interval at which they change.
Upper Band: This color indicates the highest elevation of the grid.
Lower Band: This color indicates the lowest elevation of the grid.
Carlson Photo Capture (3D only)
This feature displays the photogrammetry surfaces from Carlson Photo Capture (also known as CPC). Surfaces that have been created in CPC appear here. Switch to 3D mode, select a surface, and press Apply to view the surfaces.
Carlson Photo Capture Surface
Historical Data
The Historical Data shows machine position playback, sometimes called "traces." View machine movements during a specified date range. Live machine displays are turned off while playback is running. The Historical Data menu controls both the 2D and 3D display.
Historical Replay
Date Range: The start and end date/time for historical playback of machine data.
Show Rover Trace: When checked, a rover's movement will leave a line trace of its movements.
Speed: The speed to display historical playback. Slide the bar to increase or decrease the speed of playback. Leaving at 1 Sec/Sec will playback in real time. Click on "Sec" to switch to "Min" for even faster playback speed.
Reverse Playback: Toggle to switch between forward and reverse playback.
Advanced Playback
Options
Invalid Positions Only: Useful for showing areas where the GP did not have a GPS FIXED position on the map.
Protools Start Grid: Select the surface to load on 3D playback.
Use Reverse: In 3D display, the rovers will update the existing surface live or, as they did during the time selected. If this box is checked, the rovers will update the surface in reverse. If it is not checked, they will only update the surface while moving forward.
Update on Rotation:Toggle surface updating when the machine rotates on its tracks. These sometimes create undesired effects.
Use Machine Roll:Use the title sensor for roll in the surface updates. Leave on for modern tilt sensor configurations.
3D Display Type
3D View (On 3D playback fills will be blue, and cuts red):
Historical Replay 3D
Cut/Fill: Show cut/fill colors on surface update during 3D playback.
Deflection: Show deflection colors on surface update during 3D playback.
Limit Area: This option will limit the area to load traces in. Highlight the selection method, and then select from the plan view. Press the green check to accept the area. This is useful for only downloading points in a specific location.
Area Limit
Tools
Press Run.
Outliers: This is a tool to help track down times when the surface was updated by an unrealistic amount. This finds elevation busts, or areas where the surface has gotten out of date. It is used primarily for tracking down reports of high/low volumes from users.
Historical Outliers
Controls
Download Paths: Select this option to download a CSV file containing the positions from the selected rovers. The fields will be:
IDROVER, N, E, AZIMUTH, DATETIME, REVERSE, ROLL, PITCH, Z, ROVERNAME.
Schedule: Schedule the report to run automatically.
Pause: When Historical Playback is running, use the Pause button to pause the playback.
Play: When Historical Playback is running, use the Play button to continue the playback after it has been paused.
Jump: When Historical Playback is running, use the Jump button to skip to the next point in time where there is a valid rover position.
Load: After setting the Start and End dates for Historical Playback, hitting Load will begin loading the Historical Playback. Depending on the length of dates selected the process can take a few minutes.
Note:The red line on the timeline in the details panel shows the current state of each machine.
Press the Path Only button to get all the paths over the time selected:
Historical Path Only
3D View of paths (shown with Current Surface loaded from Command → Surfaces menu):
3D Paths
Clear the paths from the mapview using the clear button in the upper left corner of the map.
Clear Paths
Historical Data TimelineHistorical Data Controls
The field below the replay controls shows the current time of the playback.
Map Properties
Customize the presentation of the map view.
Map Properties
Map
Map Type: Select the background type for the map view.
Offline: Legacy mode with just background color, static images, linework, and surfaces.
Open Layer: Satellite live map tiling.
Background: Background color of the Surface Map.
Sky Box: Select a sky box for 3D view.
Axis Labels: Shows the grid and coordinates on the x and y axis of the map.
Map Axis Grid
Fly Over Image: Upload an optional Fly Over Image to be displayed on the Surface Map. Press Select File to upload an image. The image should be in .png or .jpg format. After uploading the image enter in the local coordinates of the corners of the image (Min: bottom left, Max: Upper Right).
Note: GeoTiff files complete the coordinates for the corner locations from the file's metadata. Check "Use as image project default" to send this image with projects to machines.
Image Corners
Surfaces
3D WireFrame: Shows the 3D surfaces as a wire mesh rather than a solid.
Wireframe Surface
2D Summary Grid: Adds summary elevations to the currently loaded surface.
Summary Grid
To Design Volume
Change this setting to get the remaining volume to grade. Fill volumes are positive and cut volumes are negative.
Cut/Fill to Design: The net difference in the surfaces.
Cut/Fill to Design
Fill to Design: Volume of fill without subtracting for cut. For Landfills this would be "Remaining Airspace."
Fill to Design
Machines
Hide Offline Machines: Choose if machines show in the map while offline.
Machine Icon Sizes: The size of the rover icons displayed on the Surface Map. Increasing this value will increase the size of the rover icons, while decreasing it will decrease the size of the rover icons.
3D Axis Helper: Shows the axis for the cut/fill position on the 3D machines. Requires a reload of 3D.
Reset User Settings
Reset user settings to defaults.
Map Tools
Map Tools
Measurement Tools: Measure Distances and Areas.
Surface Export: Export an xyz file.
Cross Section View: Rotate map along given axis.
Data Clean-up: Remove bad Grade points.
Surface Tools
Draw: Check this box to activate the polygon drawing tool. Click points on the map. Hovering will display the distance in the Hover Distance input.
Draw Hover
3D Straight: In 3D mode activating this will measure in a straight line between points. Otherwise the distance will be measured along the surface.
Hover Distance: After selecting a point this will show the distance to where the mouse is hovering.
Perimeter: The length of the perimeter of the polygon.
Surface Area: Shows the area inside the created polygon if closed.
Base Volume Elevation:Enter an value that represents the lowest possible elevation
Volume in Cut:Volume of cut in the calulation
Volume in Fill: Volume of fill in the calculation
Volume Net: The volume with fill subracted from cut or vice versa.
Controls
Clear: Erase all measurements.
Close Polygon: Connect the last point to the first point.
Close Polygon
Generate DXF: Downloads a DXF-based drawing file of the 2D polyline created in the measurement.
Save Surface: Save the surface as a .GRD file.
Volume Report: Appears once the polygon is closed. Requires Cut/Fill surface to be loaded. This button will generate a report in the bottom panel for the inside of the polygon using the Cut/Fill surfaces for the top and bottom of the volume calculation.
Volume Report
Surface Export
Export Closed
If a grid or surface is shown this tool exports the points inside a given area.. Select an area by clicking "Select from Line Work" or "Free Hand." When the Green Check mark is clicked, the total area selected shows in the "Selected Area" field. When Download xyz is pressed, a point file is downloaded.
Cross Section View
The cross section report takes any surface data and rover movements and shows them in a cross section view. The cross section report requires a different set up from other reports and is a multi-step process.
Cross Section View
Any single surface can be shown in the cross section flip, but the more interesting data are the rover movements. In order to show the cross section, data must first be loaded.
Go to Command → Historical Data to load position data. Select dates to load. The machines can be limited by selecting them in the Fleet Explorer. Press the Path Only button to display the traces from all the machines over the time period.
Once the positions are loaded, load the Surface to compare to the traces. In most cases this would be a design.
Go to Command → Surfaces → Design to select a surface to load.
Once the surface is loaded there should be something like this displayed:
Cross Section Traces
Machine traces will be in different colors per machine and the surface will be displayed as a red to blue gradient by default.
Axis Flip Path Color: The Axis Flip Path Color displayed in Cross Section reports.
By Rover: Colors paths by rover.
By Time: colors the paths from start to stop time.
Next press the Cross section button located in the Map Tools Menu.
Section Instructions
Instructions for the next steps will appear in the lower right corner of the screen. As the instructions say, select a direction line for the cross section by right clicking in the plan view.
Section Line
A green line will appear after right clicking.
Right click again to set the length and direction.
Right click again to set the width of the cross section.
Once the selection is made click the cross section button again.
Section View
The design surface will be shown in red, and the positions will be shown in colors by machine.
Click the cross section button again to return to plan view.
Layer Inspector
Check the layer inspector and hover over line work to see details about the layers in the loaded plan view file.
Layer Inspector
Layer Name: Name of the layer
Layer Type: Type of layer
Layer Color: Color of the layer
Layer Size: Size of the polylines in the layer
Layer Points: Number of points in the layer
Data Clean-Up (3D only)
Use this routine to clean up unwanted points from the database.
Data Clean-up
Go to Command → Rovers select a time period and press Path Only.
Return to the Map Tools menu.
Click Remove Rover Positions to active cleanup mode.
Clean Data Box
Left Click → Drag around points to remove.
Once selected, press Delete on the keyboard and confirm the selection.
Note: All Removed points will be made invalid and timestamped at the time of removal. They will be available under Removed Points and can be restored by selecting them and pressing Restore.
Block Models
Carlson Block Models can be used to show the type of material at a flat pad elevation, and if the material has been mined out yet, according to the current surface model generated by Carlson Protools. Select the block mode and corresponding GPF file to view. Use the slider or input field to select a pad elevation. The colors for different material types will be displayed at that elevation in the map view.
Block Models
The Slider will set a pad at the elevation indicated. Mouse over the plan view to see the type of block in the info panel at the top.
Use existing surface to show blocks as "mined out": When this option is selected, at the set elevation full colors remain where there is still material, and darker, translucent areas are mined out.
Design
Warning/Watch
The Warning/Watch Zone Creator is used to create custom warning and watch zones that are exported and used in Grade. When a machine drives into a particular zone, they are notified that they have entered a warning/watch zone.
Warning/Watch Design
Polygon Events
Event Polygons allows users to create and transfer polygons in Carlson Command that trigger the Grade machines to take a specific action or series of actions.
Access the Polygon Events under Command → Design → Polygon..
Events
An event is an action that should begin when triggered by entering a polygon, exiting a polygon, tracking onto a point, or operator login into Grade.
Polygon Events
Saved Events: Once an event has been defined, it will be selectable from the tree. A selected event will populate the Create Event section with the saved options for that event.
Press the green Plus icon in the top right corner of the Events to create a new event.
Right click the event to open a context menu.
Event Options: This section will contain all the settings for the selected or new event.
Event Name: This will be the label for the event.
Polygons: This is the area or point that triggers the event. Select a previously created polygon from the tree.
Limit Rovers: Select the machines to which this event will apply.
Limit Rovers
Actions: Select what will happen when this event is triggered.
Event Actions
Upon: Indicate a qualifying scenario:
Entering: Triggered when the machine intersects the polygon in any way.
Leaving: Triggered when the machine completely exits the polygon.
Login: (No polygon Selection).
Action: Indicate a desired response:
change_activity: sets a selected activity.
change_delay: sets a selected delay.
change_project: sets a selected project (must be in Command and on the machine).
change_radio_frequency: opens the change frequency dialog in Grade.
check_in: opens the check-in feature in Grade.
More Information
The check-in event is designed for a machine to check their elevation against a known point.
Check In
Create a point in the Create Points tab for the machine to check-into. Create and name an event. The trigger will be on "entering" and the action will be check_in. Select the point and save the event.
question: opens the question dialog in Grade.
More Information
Questions are an event action type that allows the operator to answer a series of questions defined by a Command user. These questions are completely user defined (e.g. safety checks and shift starts and ends).
Questions Menu
Press the Edit icon to open the Questions menus to create, edit, and manage the questions.
Edit Question/Answer
Polygon Q&A Manager
Groups of questions are created, selected and edited in the Q&A Manager menu. Right click on the ROOT folder to Create a new question tree. Next, name the new tree.
Create Q & A
Create Folder: Create a folder to put different Question/Answer trees into.
Create Tree: Create a new Question/Answer tree.
Deactivate: remove a tree or folder from the list.
Deactivate, Edit, Load Q & A
Edit Name: change the name of a folder or question tree.
Load Tree: Load this tree into the editor.
Polygon Questions
Create the question prompts for the questions tree. Each question should be unique and the name will be the prompt for the operator. Questions are not typed; they are simply a text prompt and can accept any type of answer.
Create Q & A
Right click on a folder to create a new folder, or create a new question. Questions will be available to select when building the question tree later in the Polygon Question FlowChart.
Note: Folders can be used as categories of questions.
Polygon Answers
Add a list of predefined answers that are possible responses to the Polygon questions. 'Yes' and 'No' are good examples of predefined responses, but other answers specific to the application could be added. Answers in this section will be available as possible responses to questions in the next section, the Polygon Question FlowChart.
Polygon Question FlowChart
Question and answer workflow are created in this section. Start with the bubble "BEGIN." Right click an element of the tree to edit it. Choose from the questions created in Polygon Questions.
Select Question
Once a question is chosen, right click to select an answer to the question. Questions are gray rectangles and answers are blue ovals. Questions can have predefined answers, or user input answers defined as numerical or text.
Select Answer
Right Click → Delete to remove a question or answer. This will remove all child questions.
Question Grouping
When answers are grouped into folders, they are grouped together in submenus when selecting answers for a question.
Question Tree Answers
From these inputs a complete flow chart can be created:
Full Q & A Tree
Lines that refer back to the previous question create a loop back to a previous question. Once there are no more questions to answer, the Grade screen will exit the questions menu and the operator can begin work.
Press "Save" to save the questions tree.
Note: The results of the questions on the machines are sent back to Command for later reporting.
warning: triggers a warning. Can have a custom message.
watch: triggers a warning, or caution. Can have a custom message.
Activity: Appears when the action type is set. Choose from the available options.
Event Activities (Example)
Press Save Event to save changes.
Create Polygon
This menu creates the polygons that can be selected in the Events tab.
Create Polygon
Polygon Name: The label for the polygon.
Select From Linework: Choose a polyline from the loaded line work.
Free Hand: Draw a polygon on the map view and store it.
Free Hand Polygon
Color: Will change the appearance of the polygon in Command and Grade.
Style: Will change the fill type in Grade.
Selected Area: Shows the area calculation for the polygon.
Create Point
Points can be used in place of polygons to trigger events.
Select From Line Work: Allows selection of a node from the line work. If the line or point selected from the linework has an elevation, it will set the Z field for this point in Command.
Create Point
Free Click: Click anywhere on the map to set the point.
Selected Point: Type in the coordinates to manually set the point. The elevation will need to be entered manually.
Press Save Point and the point will be available for events.
Transfer Events
Transfer Events
Polygons appear in the "Select Files" List in the Tools → Transfer Files menu. Polygons are limited to the fleets and machines as configured when creating the events. Send the Polygons file to any machines that will be using them. The Carlson Grade software will apply only the polygons configured for the machine.
Transfer (Send) Button
After pressing the blue Transfer arrow button, the polygon_commands.db file will be transferred to the selected machines. A Green "check" mark will appear when the transfer is complete.
Transfer Polygon(s)
Polygon Events on Carlson Grade Machines
After transferring polygon events out to the machines, the operator sees the polygons on the plan view.
Polygon Zones
Reporting
The reports found in the reporting menu will vary by industry. This manual will detail the common reports. Many of them interact closely with the map view.
For industry specific reports refer to the appropriate industry Command User Guides found in the Manuals section.
Report Output Types
Reports are available in several forms including CSV, PDF and Chart/Graph.
More Information
CSV
Information presented in the report is sent to a Comma Separated Value file which is easily opened and analyzed by spreadsheet applications such as Microsoft Excel:
CSV Report (Example)
PDF
Information presented in the report is sent to a Portable Document Format file which can be shared with applications such as Adobe Acrobat Reader:
PDF Report (Example)
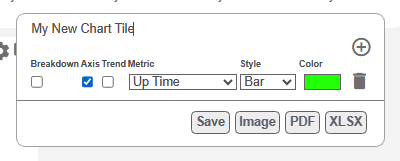
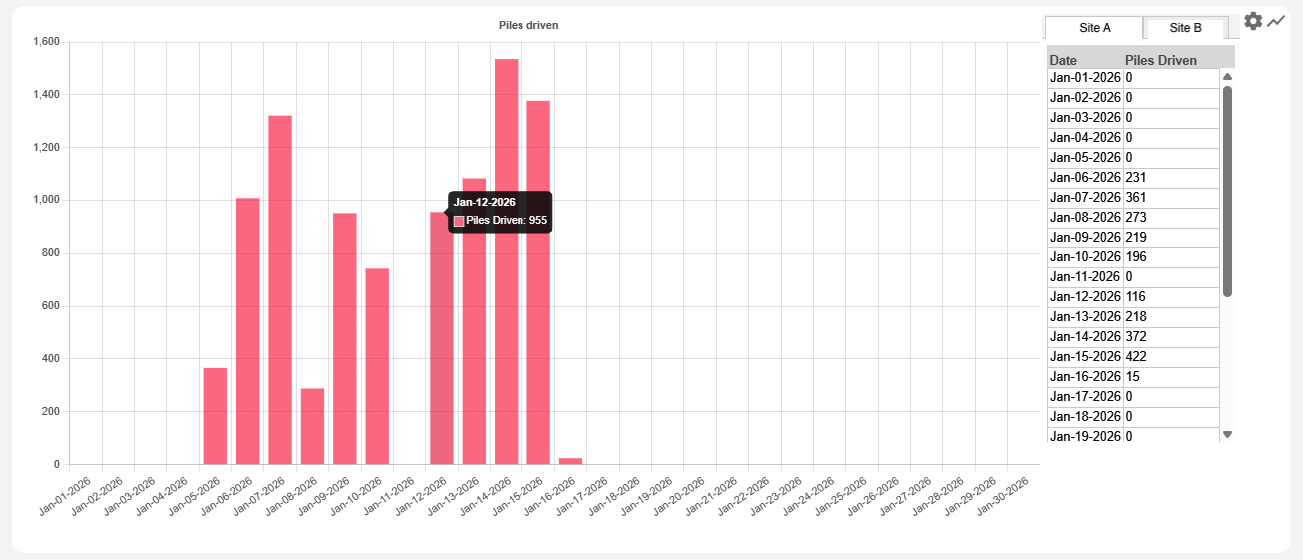
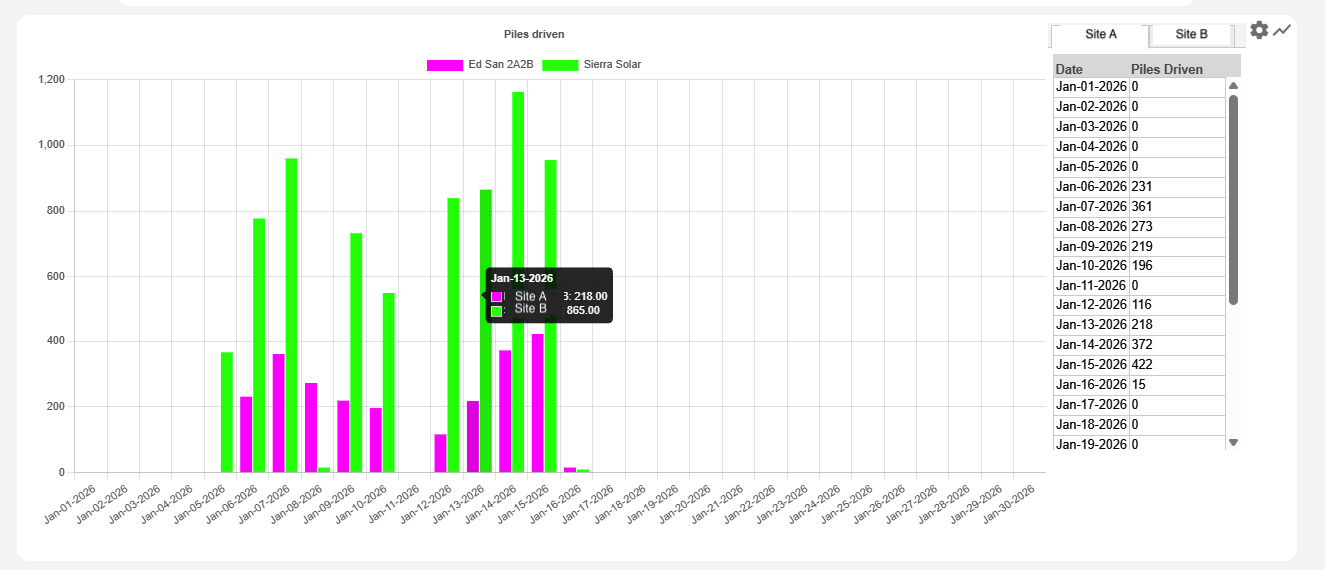
Chart/Graph
Information in the report is presented in a visual format for quick analysis:
Chart/Graph Report (Example)
Report Scheduling
Reports can be set up to be automatically emailed to users.
Report Menu
Each report's menu contains a "Schedule" button that will open the scheduling menu for that report.
Schedule WeeklySchedule Monthly
Frequency: Set how often the report should run: Daily, Weekly or Monthly.
Times: Set the start and end times for the report. The options will vary based on frequency. The "Output" time is the time Command Runs and sends the saved report.
Select the users to send the report to and Line Work that will be shown behind the plot in the report. Press "Schedule" to add it to the "Current Schedule." Click the red "X" to remove a report from the schedule.
Alert Report
The Alert Report provides information about the number and duration of alerts occurring on machines.
Alert Report
Options
From/To: Select Start and end times for the Report.
Min Duration (seconds): the minimum amount of time an alert needs to have been active to be included in the report.
Machines: select the machines to be included in the report.
Alert Types: Select the types of alerts to include in the report. This list is automatically generated from the alerts that have occurred on the machines.
Alert Types
Download Options: Set a name to appear on the downloaded report.
Outputs
The alert report displays information on the map, and in the tabs in the bottom panel:
Map: Displays the location of the alerts for each machine.
Alert Report (Map)
Alert Report: A complete breakdown of each alert occurrence with start and stop times.
Alert Report (Complete)
Summary Alerts: The total duration of each alert per machine.
Alert Report (Summary)
By Machine: Total duration of each alert for one machine.
Alert Report (Machine)
GPS Quality
The purpose of the GPS Quality Report is to use heat maps to display areas where poor GPS quality is occurring. Different types of maps can be produced to analyse GPS coverage on a site.
Name: The name will be displayed on any downloaded reports.
Date Range: Select a time period to run the report.
Base Grid: Use the max extents to use an auto-generated grid to calculate the heat maps. Select one of the Protools grids to limit to an area.
Settings
Min Passes: the minimum number of passes in the GPS state to appear on the heat map.
Max Passes: (auto-calculated) The highest number of passes in the color chart for the heat map.
Steps: The number of gradations in the heat map.
Machines: Select the machines to include for the report.
Limit Machines
Maps
Choose what to display on the map.
Invalid Positions: Only plot the heat map of invalid (bad) machines passes. Plotted as yellow → red gradient as there are more passes.
Invalid Position Report
Valid Positions: Only plot the heat map of valid (good) machines passes. Plotted as blue → green gradient as there are more passes.
Valid Positions Report
Compare Map: This map uses valid passes minus invalid passes to plot a comparison map. If the invalid positions are greater than the valid passes the yellow → red gradient will appear showing areas where bad GPS is more likely that good GPS.
Comparative Position Report
Press Submit to run the report, get a map plot and open tabs in the bottom panel with more details.
Tabs
Each machine included in the report has a tab in the bottom panel. The tab displays the HDOP and VDOP values for the machine over the period of the report.
Machine GPS Quality
The GPS Report tab shows total gradation of invalid passes using the Min/Max passes and Steps settings.
GPS Report (Graph)
The PDF button on the tab will download a PDF of the report chart and the currently displayed map view snapshot.
GPS Quality (PDF)
Grade Manual Points
This report outputs points collected by machines using the "Store Points" feature in Carlson Grade.
Note: Points can be reported by date or per file.
Options
This report lists and displays Carlson Grade store points function files. These files are automatically transmitted in from the Machines.
Manual Point Report
Point Dates
To report by date, open "Point Dates" and select dates. Then open "Filter By" and select all points files by selecting each fleet.
Manual Points by Date
Filter By Machine
Manual Points can also be filtered per machine:
Manual Points by Machine
To run the report per file:
uncheck the "Choose By Date" option and select only the files to report on.
Press "Submit" to load the points into the report.
Press "Schedule" to set up automatically emailed reports.
Display Options
Label Size: Size of labels for each point. Depends on screen size, so adjust to desired readability.
Photo Transparency: Adjust the transparency if a fly over image is loaded in the map view.
Show point labels: Toggle labels for points on/off.
Show point description: Toggle descriptions for points on/off.
Map Image: Toggle fly over image on/off.
Output
The selected points are shown in the map view.
Manual Points (Map)
The selected points are displayed in the Point Reporting tab in the bottom panel.
Manual Points (Report)
The "Point Reporting" tab has two buttons, one for CSV and one for PDF download.
Point Report (CSV)Point Report (PDF)
Grid to Grid
The Grid to Grid report compares two grid surfaces (.grd) and produces volume and other metrics. This report is a port of a report found in Carlson Civil, Survey, Construction and Mining products.
Grid to Grid Report
Options
Initial Grid: The base or starting surface. All volume calculations are relative to this grid.
Final Grid: The surface to compare to the initial grid.
Grid selection:
Enter a pad elevation.
Select a .GRD file from a drive.
Select a .GRD or .BGRD from Command.
Select a date of a Protools surface to use. This selects a snapshot surface from a date in time as updated by the positions of the machines.
Volume Type
Select what to show in the map view color map.
Cut/Fill to Design: Both cut(red) and fill (blue).
Fill To Design: Fill (blue) only.
Cut To Design: Cut (red) only.
Color Options
Grid Color Options
Upper Band: The color for the highest elevation. This represents a fill between the grids.
Grade Color: The color for no change between the grids.
Lower Band: The color for the lowest elevation. This represents a cut between the grids.
Color Bands: number of total steps between the highest and lowest elevations.
Interval: unit distance between each step of Color Bands.
Color Pallet
This shows the legend for colors as configured. Click on the colors to change the color of individual bands.
Grid Color Pallet
Limit Area
Select this option to draw a polygon. Metrics for the enclosed area are displayed in the Polygon section of the output.
Grid Limit Area
Controls
Submit: run the report.
Apply Boundary: After the report is submitted, press this to limit the area and add additional polygon metrics to the output.
Output
The map view displays a cut/fill color map of the difference between the two surfaces:
Cut/Fill Color Map
Results of "Limit Area" on map view:
Cut/Fill Color Map (Area Limited)
The data is in the "Volume Metrics" tab in the bottom panel. Press "Apply Boundary" in "Controls" to display the values limited by the polygon drawn in "Limit Area."
Grid to Grid (Table)
Initial/Final Grids: The grids selected to compare.
Grid Min/Max Corner: Coordinates of the corners of the compare grid.
Grid Cells (N,E): Number of rows and columns of nodes in the compare grid.
Area In Cut/Fill: The total area calculated for cut and fill.
Overlap Area: Area that overlaps between the Initial and Final grid.
Cut to Fill Ratio: Ratio of cut volume to fill volume.
Average Cut/Fill: Average units of cut or fill per grid node.
MAX Cut/Fill: Maximum units of cut or fill in the compare grid.
Fill/Cut: The total volume of cut or fill in the compare grid.
Net Cut/Fill: The volume difference between cut and fill. This is labeled based on whether the comparison is net cut or net fill.
Press the PDF button on the tab to download a pdf version of the report:
Grid to Grid (PDF)
Machine Properties
This is a summary report of the properties of the machines found in Fleet Explorer → Right Click → Properties.
Options
Machine Properties Menu
Rovers: Select the machines to include in the report.
Options: Select the properties to report on each machine. These will vary depending on the installation.
Download Options: Set a name for the downloaded report.
Output Examples
The properties are reported in tabular format in the bottom panel. Press the button in the tab to download the table as a CSV file.:
primary_gps_gama_uboot_version GAMA version number.
primary_gps_manufacturer: Company that makes the primary GPS receiver.
primary_gps_model: Model of the primary GPS receiver.
primary_gps_serial_number: Serial number of the primary GPS receiver.
public_IP: The Public IP address of the control box on the internet.
secondary_corrections: Secondary method of receiving RTK corrections.
secondary_corrections_network: RTK Network set for the secondary corrections.
secondary_gps_board: Type of GPS board set as the secondary receiver on the machine.
secondary_gps_firmware: Firmware installed on the secondary GPS board.
secondary_gps_manufacturer: Company that makes the secondary GPS receiver.
secondary_gps_model: Model of the secondary GPS receiver.
secondary_gps_serial_number: Serial number of the primary GPS receiver.
sensor_type: Type of sensor installed on the machine.
teamviewer_id: ID for backup remote viewing for support.
tilt_sensor_mast_id: ID of the tilt sensor mounted on the mast.
tilt_sensor_mast_orientation: Orientation of the tilt sensor mounted on the mast.
TRACE_COLOR: Color set for the historical traces of this machine.
uoa_expiration: Date of expiration of the license on this machine.
uoa_number: The 20 digit code used to generate the license file for this machine.
vehicle_type: The vehicle type for which the machine is configured.
Polygon Events
Polygon Event Reports are reports triggered by the events created in Command → Design → Polygon Events. There are two reports in this section for special types of events.
Polygon Report Menu
Date: Select start and end date/times for the report.
Report: Select the type of report to run.
Check-In Report: Outputs all of the "check in" events for the time and options selected. The check-in event is designed for a machine to check their elevation against a known point.
More Information
Check-In
The options section for the Check-In report has two groups of options.
Polygon Check-In Report
Tolerance: This affects the display of the points on the map. Points within tolerance of all "checked" values will be green. Points out of tolerance will be red.
Check-In points: select which check-in locations to report.
Polygon Check-In Table
A table of all check-in points will be loaded into a "Check-In" tab in the bottom panel. The table contains the following:
The Check-in Name.
Time stamp of the check-in.
Operator (if applicable).
Machine Name.
Coordinate of the control point.
Coordinate of the actual reading.
Error for each coordinate parameter.
Question/Answer Report: Outputs all of the questions and answers for the time and options selected. Questions are an event action type that allows the operator to answer a series of questions defined by a Command user. These questions are completely user defined (e.g. safety checks and shift starts and ends).
More Information
Question/Answer Report
Use this report to pull operator's answers to the Q&A event type. Select to filter the report by Machines or Operators, and then select the Question/Answer list.
Polygon Question & Answer Report
Note: The events are shown individually with all of the answers for that event.
Polygon Question & Answer Details
A new Q&A tab will appear in the bottom panel. Press the PDF or XLS buttons to download an offline copy of the events:
Polygon Report (PDF)
Name: Input a name for the report. This name will be on the downloaded report outputs.
Options: Other filters for the report.
Machines: Select the machines to include in the report.
Machine Report Option
Operators: Select the operators to include in the report.
Operator Report Option
Polygon Time Report
The polygon time report is a summary of some of the Uptime reports run only on a specific area.
Polygon Time Report Menu
Note: Only machine movements in a user-defined area are included in the report.
Options
Select Limit Area and then define the area. The area can be selected from line work or drawing in the map view.
Polygon Time Report (Area Limited)
Output
The Polygon Time Report includes the Machine Time Breakdown of:
Uptime: All of the time the Control box on the machine is powered on and Carlson Grade is running with Streaming enabled in Communication settings.
Run Time: Time the machine is said to be "moving" based on the setting "Min Running Speed" in Settings → Limits.
Idle Time: Time the machine is said to be "stopped" based on the setting "Min Running Speed" in Settings → Limits.
GPS Down Time: Any time during a session where the GPS is not in a "Fixed" state, or a vital sensor such as a tilt sensor is offline.
Session: One session of uptime from Grade start to Grade stop.
Note: Also included are Distance, Average Speed and GPS Uptime.
Pre-Start Checklist
Carlson Grade may be configured for operators to fill out a pre-start check list on login.
Options
This report will display the results of those checklists.
Prestart Report Menu
Report Name: The name for the PDF and CSV downloads of the report output.
Choose by Date: Optional. Select a date range to limit the time period for the completed checklists.
Filter By:
Machines: Select machines to include in the report.
None: Select None to run the report for all machines.
Status: Select what kinds of answers to include.
Good: Include answers that were marked checked (green).
OK: Include answers that were marked as an issue with notes (yellow).
Bad: Include answers that were marked broken (red).
Current Only: Only display alerts currently ongoing.
Output
Each machine included gets a tab in the bottom panel. Each tab contains all of the pre-start checklist instances for that machine in the selected time period.
Pre-Start Checklist Table
Time: Time stamp when the checklist was filled out.
Operator: Operator who completed the checklist.
Columns:
Question: The prompt the operator responded to.
Response: Either the input the operator typed in or the check mark they chose.
Notes: Information provided by the operator (if any).
Uptime Reports
Uptime reports are all of the time based reports broken down into industries for specific types of reports.
Terms
Uptime = Run Time + Idle Time + GPS Down
Uptime: All of the time the Control box on the machine is powered on and Carlson Grade is running with Streaming enabled in Communication settings.
Run Time: Time the machine is said to be "moving" based on the setting "Min Running Speed" in Settings → Limits.
Idle Time: Time the machine is said to be "stopped" based on the setting "Min Running Speed" in Settings → Limits.
GPS Down Time: Any time during a session where the GPS is not in a "Fixed" state, or a vital sensor such as a tilt sensor is offline.
Session: One session of uptime from Grade start to Grade stop.
Uptime Report Table
Note: The switch between "Running Time" and "Idle Time" is based on the setting "Min Running Time" in Settings → Limits. A machine has to remain in one of the two states for at least this long for it to be considered a change in state.
Uptime Report Menu
Name: This is the name that appears on report outputs.
Date Range: All time reports must be run over a time period. Set start and end times for the report.
Machine Paths: Select which machines will be included in the report.
Note: Command Center users with access to multiple sites may select machines across multiple sites.
Output Format: Select how times will be displayed.
HH:nn:ss: Hours, Minutes, Seconds.
HH.hhh: Decimal Hours.
% Uptime: Percent breakdown of each metric of the total uptime.
Minutes: Total minutes.
Download Format:
CSV: A spreadsheet format with only the report headers and values.
PDF: A document format with a chart and graphical representation of the data.
Controls
Submit: run the report and output any data directly on the map page. Tables of data open in the bottom panel in a new tab. On the tab is a button to download in the selected format and a button to open the graph, if applicable.
Save: Saves the settings and the type of report for easy future access. The saved reports appear in the Saved folder of the report tree.
Uptime Saved Custom Report
Schedule: Open the Scheduling menu. Uptime Reports can be saved and scheduled. Scheduled reports are delivered to the selected user's email.
Activity Machine Breakdown
This report shows how long each machine was set to an activity or delay.
Activity Time Breakdown
Daily Machine Time Breakdown
This report is the breakdown of "Uptime," "Run Time," "Idle TIme," and "GPS Down Time" per day, per machine. It includes the start and stop times for each session the machine was online for each day. It includes a total and average for the machines and dates selected.
Daily Time Breakdown per Machine
Machine Time Breakdown (Uptime)
This is the classic "Uptime Report." It is a breakdown of all the time metrics in total for each machine over the time period selected.
Uptime Report Table
Press the Image icon to open the graph of the data.
Uptime Report Graph
Press the PDF button to download a PDF of the report.
Uptime Report (PDF)
Operator Time Breakdown
This report outputs the amount of time each operator spent running each machine.
Operator Uptime Report
Warning/Watch
This report outputs occurrences of machines entering warning or watch zones. Entry into a watch or warning zone is marked with a circle icon matching the trace color of the machine that entered the zone.
Warning/Watch Report
Options
Report Name: The title of the downloaded report.
Date Range: Select the start and end dates for the report.
Limit Machines: Select machines to include in the report.
Press "Submit" to run the report.
Output
Points where the machines triggered the alert for "Watch" or "Warning" are plotted in the map view. The alert is triggered when any part of the machine crosses the zone. The plotted circles match the trace color setting for the machine.
Warning/Watch Report Table
Machine, Zone type, Number of times inside, and Duration inside are displayed in a table in the "Warning Watch" tab in the bottom panel.
Press the PDF button in the tab to download a PDF.
Warning/Watch Report (PDF)
Tools
The Utilities of Command.
Icon Links
The Tools menu features several useful tools and utilities that can be easily accessed from any page within Command. Available are utilities such as:
The File Transfer page is used to send files and projects to the machines without leaving the office. The left panel contains a list of available files to send. The right side of the screen contains a list of fleets/rovers to send to.
File Transfer
Note: File Transfer can also be accessed by using the "Send" icon hot button in the toolbar.
Select Files
Files on the left are arranged in a tree menu. Clicking a file or category makes the check box with a green check. A green box will appear in the top level of the tree indicating that some items in that branch are selected.
Select Transfer Files
Activities: Select this to send out all configured activities codes to selected machines. Activities are configured in Tools → Fleet Management → Operational Codes.
Delays: Select this to send out all configured delay codes to selected machines. Delays are configured in Tools → Fleet Management → Operational Codes.
Down Codes: Select this to send out all configured down codes to selected machines. Down Codes are configured in Tools → Fleet Management → Operational Codes.
My Files: To upload custom files, right click the My Files item to access the context menu. Select "Upload File" and browse to the file on the local PC.
Upload File
Operators: Select this to send out the Operator login list. The Operator login list is configured in Tools → Fleet Management → Operational Codes.
Polygons: Send polygon events to machines. Polygon events are configured in Command → Design → Polygon Events.
Projects: Expand this menu to access all of the Grade Project configured for this site (Tools → Grade Projects). Select the project(s) to transfer to the machine.
Note: Project transfers have the option of being made the current project on the machines or just being sent and loaded manually by the operator at a later time.
Project Transfer Reload
Send only: Transfer the project to the machine. This makes the project available for selection by the operator.
Reload: This will load the project when the transfer is complete.
Slopes: Slopes (Grade operator created slope files) imported from other machines..
Grade Updates: The latest patch updates for Carlson Grade. Send the matching patch for the machine type. The patch will be applied on the next restart of Carlson Grade. (Requires v8.4 or higher).
Machine Files: Select the Fleets or Machines to send the file to. The Fleets and Machines are organized in the tree structure established in the Fleet Management → Fleets/Machines menu of Command.
Transfer Files (Machines)
A selected machine will have a green check box indicating that it has been selected to receive the file. Multiple machines and or fleets can be selected to receive files. A green check at the fleet level indicates that all machines in that fleet are selected. A green box indicates that some machines or fleets below it are selected.
If a rover has a red dot icon the machine is currently offline and will not receive the transferred files until it comes back online. Sending files to offline machines is allowed. Command will send the files once the machine is online.
If a rover has a green dot icon, the machine is currently online and ready to receive files.
After selecting the file and machines to receive files, click the "Send" button to begin the file transfer.
File Transfer Queued
The files are now queued to send. Leaving this page will not interrupt the file transfer. View the progress of the current file transfer right here or from the Command Map page in the Transfer Queue window. Expanding the Machine's tree will show the projects on that machine and the current status of the files transfer(s) being sent.
To delete a single project, right click a project on a machine to open a context-menu. Select "Delete."
Delete Single Project
To remove a project from multiple machines or fleets, use the Remove File, "X" button.
Select the machines, then click the Remove button. A status bar will appear indicating the current status of the project removal. Leave the page, once the transfer process has started, this will not interrupt the transfer. The status of the transfer will also appear in the Transfer Queue accessible from the Surface Map page.
Grade Project Manager
This is the central location where all Grade Projects are created and edited. Project files including linework, surfaces, localizations, and project options are chosen in this location. The simple and distinct icons provide easy navigation.
To access the Grade Project Manager window, select Tools on the main Command toolbar, then Grade Project Manager.
Grade Project Manager
The left side of the Grade Project Manager window displays the folders and project folders. The right side displays the Files Window, organized in folders by file type. The Files Window will also be the location where file Options are adjusted.
Projects Window
Grade Projects Menu
Add New Folder.
Add New Project.
Delete Selected Folder or Project.
Make a copy.
Download PRZ.
Upload/Import PRZ.
Note: The company's site name is the primary folder name and location the projects are saved. Create as many Folders and Subfolders as necessary for the project(s) being created.
Right click any folder and select (Add Folder) or select the folder and use the "Add New Folder" button in the toolbar.
Project/Folder Management
Create a Projects Folder and Sub Folder by right clicking the Root folder and select Add Folder.
New Project/Folder
Note: Folder names are unique. Rename "New Folder" prior to creating another folder.
To begin creating Grade Projects,Select the New Project icon or use the right click menu button on a project folder. Type the necessary information as prompted.
Click the maximize arrow to the left of the project description to open the project folders (e.g. Additional Files, Coordinate System, Plan View Files, and Surfaces).
Grade Project Files
Additional Files: Optional files.
Block Models (Mining only): A geological material model.
Coordinate Files: List of stakeout points.
Guideline Files: Steering file .CL.
Coordinate System: Geoid or Localization Files and Coordinate System Options.
Plan View Files: plan view or linework for the operator.
Surfaces: (Any Carlson Grade compatible Surface file format) The Surfaces folder has multiple subfolders:
Surface Files
Existing Surface: The existing surface of the area in which the primary design surface will cover. This file must be a grid(.grd or .bgrd format).
Primary Design: The primary design surface that will be used in the project.
Secondary Surfaces: Additional design surfaces that can be switched in the main Grade view.
Warning Surfaces: Surface files from the design surface which might include WARNING zones or boundaries to alert operators they are near a hazard or obstruction.
Watch Surfaces: Surface files from the design surface which might include WATCH zones or boundaries to alert operators when they are near or within a hazard or obstruction.
Files Window
The Project Files window consists of five key functions for project file selection. Use Search bar to search loaded files by specific name or characters.
Select Files Menu
Transfer to Project Folder.
Sort by A-Z/Z-A.
Sort Files by Date.
Upload Files.
Delete File.
Files in the Grade Project Manager are organized in the Files folders, according to the file type (extension):
File Organization
Maximize the drawing format folder in the Files window to view loaded files:
Expanded Folders
Drag files to the appropriate Projects file folder.
Drag-n-Drop Management
Note: If the file is compatible with the folder, a Green Check appears next to the file name.
Note: If the file is not compatible with the folder, a Red X appears to the left of the file name:
Incompatible File
Transfer files to the needed folder by selecting both File Folder, and File, then click the File Transfer arrow located in the task bar.
Move File
When transferring a file from the Files Window to a folder in the Projects window, the folder in which the file is transferred to will automatically maximize to show the file has been successfully placed.
Expanded Project
Project Options
The Project Options tab alters specific project options.
Project Options
Project Description: a description of the project[defaults to project name].
Units: Units the project will be displayed in.
Surface Update Method: How the project will update the existing surface in Carlson Grade.
Update Nothing: No surface updating.
Update for cut only: Updates the surface only when the cutting edge of the machine is below the surface (typical for excavators, shovels, blade elevation dozers).
Update for cut and fill: Update the surface above and below the surface (typical for track elevation indicate machines).
Vertical Tolerance: Cut/Fill and On Grade tolerances for the Cut and Fill values displayed to the operator.
Vertical Tolerances
To add, select the "Add" button, select a color and enter a desired tolerance.
To remove, select the desired tolerance, and click "Remove."
Add Tolerance
Vertical Tolerances may also be edited. To edit, click the color and select a new color from the color palette.
Edit Tolerance Color
Vertical Offset: "offset" the design surface.
Vertical Increment: Increment amount to offset the project design??? using the increment QuickKeys located on the Grade toolbar.
Lock Vertical Offset: Locks the vertical offset to the initial value. In Grade there is an option to have up/down arrows on the toolbar allowing the operator to change the vertical offset. If "Lock Vertical Offset" is checked these arrows will be inoperable for this project.
Notes: Message for the operator about the project. Displays on project load in Carlson Grade.
Project File Options
Within each project file folder, subfolders might have additional options. To select the options, click the Folder, then select Options within the Files window.
Coordinate System Options
To select the geographical Projection, click the folder button to begin. Select Spatial References, Country, Grid subfolder, then Zone/State/Region.
Project Coordinate System
Coordinate system information will populate in the table provided. Select OK once completed.
Coordinate Systems
One Point Alignment
One Point Alignment
Align to Grid: (default) The project is oriented to the flat coordinate grid used by the machine.
Geodetic: The project is oriented to the curved surface of the Earth.
Transformation
Transformation
Plane Similarity: applies a 2D transformation that allows shift, rotation, and scale in the horizontal plane.
Rigid Body Without Scale: applies shift and rotation only, with no scaling.
Helmert Seven parameters: applies a full 3D transformation.
User Defined Projection: allows the user to manually specify the coordinate system and projection parameters.
Scale Factor: Controls how distances in the project coordinate system relate to true ground distances.
A scale factor of 1.000000 means grid distance equals ground distance.
A scale factor greater than 1.000000 means distances are slightly expanded.
A scale factor less than 1.000000 means distances are slightly compressed.
Surfaces
Existing Surface: This is a surface used to record the changes in elevation to the actual ground. This surface must be a Carlson GRD or BGRD file.
Primary Design: This is the primary or final design of the project. The actual ground should match this surface at the end of the project.
Secondary Surfaces: These are intermediate design surfaces used to give smaller targets over the course of a project.
Warning/Watch Surfaces: These are surfaces that warn the operator when the cutting edge or tracks of the machine are above or below the surface.
Note: Existing Surfaces, Primary Design, Secondary Surfaces, Warning Surfaces and Watch Surfaces all have the same options.
Select the surface file in the Project window and select the Options tab within the Files window.
Surface Options
Save Passcount and Compaction Data: Default Checked.
Show Non-Surface Data: (Polylines, Hatching, Text) Allow the operators to view contour, markings, text and other drawing graphics.
Visible: Whether surface is visible in project.
Warn Method: Direction of surface breach in order to warn operator.
Show 3D Surface As: How to display surface in 3D mode (solid,wireframe, or none).
Line Color:Line Color is selected using the color palette dropdown.
Line Style: Select the Line Style that is displayed with the surface option (e.g. Empty, Solid, Dotted, Center, Dashed, etc).
Fill Color:Fill Color can be selected using the color palette dropdown.
Fill Style: Select the Fill Style that will be displayed with the surface option (e.g. Slash, Back Slash, Interleave, Wide Dot, Close Dot, Empty, Solid, Line, Light Slash, Light BackSlash, Hatch, Cross Hatch, User, etc).
Fleet Management
Fleets/Machines
In Command, set up a fleet and machine for each machine.
Go to Fleet Management → Fleets/Machines in the Toolbar dropdowns in Command.
Add Fleet
To add an additional fleet, right click on a fleet or the ROOT fleet to open the context menu. Choose 'Add Fleet' and name the new fleet.
If the site is new, there is a default fleet named machines. Use this fleet to add the first machine and rename as desired.
Add Machine
Right-click the Fleet name to open a context menu. Left-click a machine in the tree to edit it in the same menu.
Deactivate: Send this fleet to the "Inactive" folder of the tree. This will remove it from use.
Move From: Select a machine from another site to move to the current site.
Move To Machines
Add Machine/Edit Machine: Enter information about a new machine for the fleet.
Add/Edit Machine
Name: Unique identifier for this machine. This should be some official designation like a short description and a serial number, or equipment number. This name is entered into the machine in Carlson Grade to connect the machine to Carlson command.
Machine Type: This is a list of possible machine types that is determined by the industry of the Command site.
Fleet: This will auto populate with the fleet that was right-clicked but can be changed now or later.
Trace Color: This is the color for traces in historical playback and other reports. It can also be changed on the map view page from the Fleet Explorer → Right Click → Properties menu.
Surface Update Type: How this machine will affect the existing surface is Carlson Protools.
None: Protools will ignore this machine and its positions will not be used to update surfaces,.
Cut/Fill: All positions will be used to update surfaces, whether those movements result in a cut or a fill.
Cut Only: Only movements that result in a cut will update the surface. This is useful for the teeth position of an excavator that will be above the surfaces during some of its movements.
Swing Cut: Swing cut will update the surface at track elevation in a radius from the center of rotation to the extent of the reach of the machine. This would typically be used for a cable shovel excavator with only track position and heading.
Hardware ID: An automatically generated hardware identification number that identifies the computer reporting as this machine. It is auto-populated when Carlson Grade connects to Command. It must be reset when a new computer is used for this machine.
Stream Agents: This selection controls whether this machine connects to the Command service agents for different functions. The available stream agents and default selections are determined by the industry and machine type.
Position: (Common) Collects and broadcasts the positions of machines to the other machines.
Pile: (Solar) Syncs the pile databases between Command and Pile drivers or placement machines.
Landfill: (Grid) Syncs the existing surfaces between machines.
Work Perimeter: Syncs the landfill work perimeters between machines.
Drill: Syncs the drill hole database between Command and the Drill rigs.
Add Fleet: Add a new fleet to the site.
Name: Name the fleet. Can be by type of work or type of machines or some other distinction.
Parent Fleet: Fleets can be grouped together within other fleets. For example a dozer fleet within a mining fleet vs. a dozer fleet within a reclamation fleet.
Press "Apply" to save the new machine or edits.
Workflow - Adding a New Machine
This is a walk through of steps to add a machine coming online for the first time.
Command
Go to Fleet Management → Fleet Management.
Right Click a fleet to add the rover.
Add Machine
Give the Rover a unique name and configure the settings. This name will be what the system uses to identify what messages are coming from which piece of equipment.
Grade Streaming
Note: This section assumes the machine is connected to the Carlson VPN. For detailed instructions on this configuration refer to the Grade Streaming Setup.pdf document. Streaming is the transfer of position and sensor data only.
Grade Streaming
In Grade go to Tools → Options → System Options → Communication Options. Select "Enable Streaming" and then open Streaming Options.
Streaming is set to:
appserver.carlsoncommand.com
The "File Transfer Address" is set to:
filetransfer.carlsoncommand.com
The "Command Address" is the address of the Carlson Command Server:
carlsoncommand.com
Note: It is used for special data requests from Grade to the server. These settings are the configuration for all machines unless instructed otherwise by Carlson.
"Company" is the name of the Command being connected to. This can be found in the Toolbar at the top of the Command site:
Site Name
"Rover Name" is the Machine name from Command. Company and Rover Name are not case sensitive fields and will lowercase all inputs.
Server and Local ports should be left at the default of 2750.
Note: If all of the settings are correct, the Streaming Icon appears in the status bar. If the Icon has a red X over it, it cannot connect to the server with the current settings. Double check all settings. If Grade still cannot connect, contact first level support for the Carlson system.
Streaming Status
Changing Hardware on a Rover
When the control box on a piece of equipment is swapped for a replacement, enter in the settings for the machine or load a settings back up input the new box. Then Reset the Hardware ID in Tools → Fleet Management → Fleets/Machine → Select Machine.
Refer to the quick guide "Transfer Control Boxes Guide.pdf" for details.
Manage Operators
The Operator Manager adds and edits the operators. Choose to view or edit operators from a specific fleet or from all fleets by using the fleet selection box located in the title bar. Add additional operators by hitting the "Add" button located in the title bar. The following are the basic info to assign to an operator:
Manage Operators
Name: The name of the operator.
Right-click the operator name in the tree to deactivate or activate an operator.
Right-click Operator
EmployeeID: The employee id of the operator. Can be alphanumeric.
Note: Press "Apply" to save the changes.
Upload CSV: Upload a CSV file of operator name and employee ID to bulk import operators. Format:
operator name,operator ID
Manage Operational Codes
Operational Codes are descriptions of time used by Carlson Grade machines to tag time periods for different uses.
Operational Codes
Activities, Delays and Down Codes
Activities: An activity is a description of work over time. The machine should be actively working during an activity. Carlson Grade can be set to require an activity at all times.
Delays: Descriptions of times when Carlson Grade is ON, the machine is powered ON, but it is not working or it is sitting idle. Carlson Grade can be configured to automatically force the operator to choose a delay if the machine is idle for too long.
Down Codes: A Down Code is an indicator telling machine to stop, pause, or indicates a problem, preventing operation until resolved:
Code: The identification number associated with an event. In Grade this can be entered to quickly find the code.
Name: The name of the operational code.
Description: Any additional details or info about the code.
Fleet: Set by the position in the Code Management tree. "Root" refers to the top level. If the code is in the top level then it is in all of the nested fleet lists. If a fleet has subfleets, then the code is in all of the subfleet's lists.
Active: Uncheck Active to remove the code from the list.
Pre-Start Checklist
The Pre-Start Checklist is a feature that records the operator's pre-start or pre-shift inspection of the machine. It is configured in Command then transferred to the Machine in the File Transfer menu.
There are two types of Pre-start codes:
Pre-Start Questions: Questions that are asked to the Operator that require some more input than a simple yes or no response.
More Information
Select Pre-Start Questions under root in the left hand tree.
Press the + icon at the top of the new section and enter a name to add a tab. Tabs will group the questions together on different pages with a header prompt for the Operator.
New Question Group
Enter a Question prompt, and select an Response type from the pull down menu. Press "Add" to accept the new question.
Pre-Start Questions on the Machine
The Text response type will prompt the operator with a keyboard to enter in the response.
Text Response
Number will open a keypad.
Number Pad Response
Grade presents a summary of the questions and answers after they are answered. The edit buttons allow the operator to change the answers.
Prestart Questions & Answers
Pre-Start Lists: Presents a check-list to follow.
More Information
Select Pre-Start List under the fleet to add checklists.
Press the + icon at the top of the new section and enter a name to add a tab. Tabs will group the checklists together under a header for the Operator.
New List Group
There are two types of checklist items:
Critical:Critical items must be accompanied by a downcode. If a Critical item is failed by the operator, Grade will exit with a downcode.
Critical Item
When a critical item is failed, Grade will enter the Downcode state. The operator can choose to log off, Clear Code, or exit the Software (password protected). Clear Code will allow the operator to continue working. The operator who clears the code is logged in Carlson Command.
Force Down Code
Log Off returns Grade to the login menu. The downcode must be cleared before the machine can use Carlson Grade again.
Operator Login
Non-critical:Non-critical Item
The first tab for this demo is labeled "Critical." We only add critical items to this list. Enter a name for the item and then select a downcode. Apply an existing downcode to the item, or make a new one based on the name of the item by selecting "Use Question."
Use Question
After selecting "Use Question" enter in a code for this new downcode ROPS. Codes must be unique across all lists. The code can be used in Carlson Grade to select a downcode. If the code is not unique, Command will prompt the user to choose a different code.
Create Downcode
Press "Add" and the new item will be added to the list. This is after everything is entered correctly:
New List Item Added
Drag and drop the lines to reorder the list. Using the Order icon.
Manage List Order (Drag-n-Drop)
Optionally add another tab. In this case the items are all Non-Critical.
Pre-Start List on the Machine
The operator is prompted after the Questions to fill out the check lists. They are grouped by the tabs created in Command.
The operator taps the circle for Pass (Green), A Medium level (Yellow), and Failed (Red).
Checked List
For the Yellow or Red options, the operator must enter a reason for not passing the item.
Non-passed Note
The summary will show the selections and notes for each item.
Summary Notes
Both lists will open after the operator logs into Carlson Grade.
Users
A summary of configured Users is presented.
User Table
The quick info users table has the following data.
Username: The login name for Carlson Command.
Name: Full name of the user.
Phone: The mobile phone number of the user.
Email: The email address of the user.
Role: The custom role assigned to the user.
Notes: Hover over the notes icon to see any notes saved for the user.
In the Users menu, there will be a list of the users for this site. Click 'Add New User' to create a new user, or click on the row of an existing user to edit that user.
Enter the new user data into the form that appears.
Note: Pressing 'Cancel' will clear all changes, and pressing 'Delete' will remove the user from the list.
User Information
Username: The username for the user, this will be their login for Command.
Send Initial Email: Use this option instead of setting a password. The user will be emailed at the email provided with a link to set their own password. Only available at or a local server with an SMTP email connection configured.
Password: The password for the user login.
Reset Password: (edit only) Send an email to the user's email with a link to reset their password.
First Name: User's first name.
Last Name: User's last name.
Personal Email: User's email address.
Phone: Phone number for user. This should be a mobile phone number if 2-factor authentication by text is configured.
Role: Select from premade roles or select "Add" to create a new role.
Add Role
Permissions: Select the features to which the user will have access:
Admin
DATA_EDITOR_ADMIN: Admin access to Tools → Data Editor.
DRILL_UTILITIES_ADMIN: Access to Drill Utilities for managing Drill folders, and file uploads.
PILE_UTILITIES_ADMIN: Access to Pile Utilities for managing Drill folders, and file uploads.
PROTOOLS_MASTER: Access to the Protools menu for setting the site's existing surfaces, and start/stopping the protools service.
SETTINGS: Access to Command Settings.
VASCO_ACCESS: Access to the webview of remote Vasco Receivers.
Editor
3D_REMOVE_POSITIONS: Access to MapTools → 3D Remove positions. This is an editing tool to remove positions from the database that are erroneous.
DATA_EDITOR: View access to the Tools → Data Editor.
DESIGN: Access to design surfaces in Command → Surfaces.
DRILL_MANAGER: Access to the Drill Utilities menu for importing, exporting, and managing drill patterns..
FILE_TRANSFER: Access to the Tools → File Transfer page.
FLEET_MANAGEMENT: Access to the Tools → Fleet Management page.
GRADE_PROJECTS: Access to the Tools → Grade Projects page.
HISTORICAL: Access to Command → Historical Data.
IMPORT_GRADE_FILES: Access to the import grade files feature in the Fleet Explorer → Right-click menu.
INSTANT_MESSAGE: Access to instant message Carlson Grade machines in the Fleet Explorer → Right-click menu.
OVPN_DOWNLOAD: Access to download the Open VPN file for a machine in Tools → Fleet Management → Fleets/Machines → Edit Machine.
PILE_MANAGER: Access to the Pile Utilities menu for importing, exporting, and managing pile patterns..
PROTOOLS_USER: Access to Protools to generate personal Protools runs to create a single use existing surface.
VIEW_SCREEN: Access to view the screen of a machine in Fleet Explorer → Right-click menu.
VIEW_SCREEN_CONTROL: Access to full screen control in view screen.
WEIGHTS: Access to enting weights for Landfill Density reports.
Reporting
CONSTRUCTION_REPORT: Access to the Construction report in the Reporting pulldown menu.
NO_AUTO_LOG_OFF: Do not log off this user after an inactive period.
REPORTING: Access to the Reporting pulldown menu.
Upload Only
UPLOAD_ONLY: A special user type. Selecting this option unchecks all other permissions. This user can only upload patterns for Drill sites. If checked, select which patterns the user has access to upload.
Configure Upload Only
Clone Settings: Select another user's settings to clone for the new user.
Lock Settings: Lock this users settings so anything that is changed in a session reverts back to the saved settings on the next session.
Microsoft Login: Configure this user for Microsoft SSO (Single Sign On). This setting means the user will use the Microsoft button on the login page rather than a username and password. Microsoft will authenticate the user for Carlson Command in a separate window.
Notes: Notes is a custom field for any information that might be useful to save about the user.
Press "Apply" to save the new user.
File Browser (Command)
The File Browser can also be accessed from the toolbar 'Hot buttons' Folder icon. The File Browser provides access to all of the files stored in Carlson Command.
File Browser
The File Browser is separated into three main sections.
Files
Files are any files that have been uploaded into Carlson Command. They are separated into extension types.
File Types
Right-click a file to open a context menu.
Download: Downloads the original file to the user's local computer.
Import to Command: Many files may have been uploaded for use in Carlson Grade Projects but not converted for us in the Command map page. Command uses special formats for display in the web drawing and surface viewer. "Import to Command" will convert the files for view in the map. Imported line work files will appear in the Command → Line Work section and surfaces will start in Command → Surface → Design.
Delete: This will remove the file from Command.
Sorted Files
Right Click the "Sorted Files" folder to add a New folder.
Sorted Files - New Folder
Right Click any folder to open a Context menu.
Rename: Change the name of the clicked folder.
Delete: Remove the folder and its contents.
New Folder: Create a subfolder of the clicked folder.
Sorted Files
Drag files from the "Files" tree into the sorted files folders to add them to the custom sort.
Protools
Use the Protools folder of the file browser to access all of the outputs of Protools.
Protools Folder
Individual user runs will be in folders with the users name. The protools_service folder will have all of the existing surfaces processed by protools including grids that are no longer running as part of the service. There is a snapshot grid at each of the output times. The file with the original name of the surface is the most up to date version of the file.
Right-click the files to open a context menu. Download the surface in one of three file types:
Grid: Carlson format .grd file.
Point: Grid as coordinates in CSV with extension .xyz (prompt for downsampling the number of points).
Down Sample Option
None: download each grid node as a point in the XYZ file.
¼ - 1⁄16: Downsample the points to a fraction of the points. This will reduce the accuracy of the surface but will reduce the file size.
Contour: Contour .dxf file of the surface (prompt for contour spacing).
Protools
Carlson Productivity Tools (sometimes called Protools for short) is the surface calculation service that uses all of the database rover positions to play back those rover movements (updates) over a Carlson Grid file to create an up-to-date as-built surface.
Protools can be accessed by selecting Tools, then Protools in the Command bar, or by selecting the Protools icon to the left of the site name.
Protools Menu
Volume Calculations
Productivity Tools calculates volumes by using the stored position data. The position of the GPS antenna is sent from Carlson Grade to the database on intervals based on a series of conditions.
Grid Mesh
Change in Time.
Change in Distance.
Change in Elevation.
Change in Direction.
These positions are stored with Machine ID, Time stamp, Northing, Easting, Elevation, Normal, and a Reverse flag. The movements are then "played back" and the positions with the Normal and the width of the machine are used to update the elevations of the grid nodes. As the nodes of the grid are updated, the volume between the previous grid and the current grid is calculated and stored in a separate table in the database. These stored volumes are then summed for reporting in Carlson Command.
This image shows the way the updates are applied to a grid surface. In this diagram, the machine is moving in a North Eastern direction with a 4m blade width. It travels approximately 10 meters. The shaded cells are the grid nodes that would be updated to the blade elevation in this motion:
Grid Update
This image shows how the cross slope is applied to grid updates. The position of the GPS antenna is combined with a slope sensor to get the slope of the cutting surface:
Grid Cross-Section
This image shows Carlson Grade tracking over an area for the first time to create a base grid. Positions are then transferred into the database and Productivity Tools to create a surface. The grids are set to 4 ft (1.2m) spacing:
Grid Grade
This image shows the grid surface, created by the movements of the machine, drawn in Carlson Civil. It is practically a flat surface:
Grid Civil
This Image shows the machine in Carlson Grade passing back over the same area at an elevation about 2 ft (0.6m) lower than the first pass. This produces a cut as the surface is updated to the new elevation.
Civil Grid Updated
This image shows the surface as it looks in 3D after the positions are applied and the surface is lowered. Carlson Productivity Tools is able to calculate the volume of change in the surface on each updated position, store that information and then write it to the database. When Carlson Command runs a report for volume between two periods of time, the volumes stored are summed between the start time and the end time selected by the user.
Run Protools
Input Grids (Advanced Options)
Protools - Input Grids
Check the "Advanced Options" checkbox to see additional options:
Volume Settings
Volume Settings
These filters determine how Protools will apply the rover update on a surface. The filters are broken down into three main machine types:
Cut/Fill Machines: Cut/Fill machines are any machines that can update the existing surface for both cut and fill (e.g. bulldozers, compactors, pickups, etc). Settings for Cut/Fill machines include:
Min Fill Grid: The minimum fill required in a pass to update the surface.
Max Fill Grid The maximum fill to be applied when updating the surface.
Min Cut Grid: The minimum cut required to update the surface.
Max Cut Grid The maximum cut to be applied when updating the surface.
Max Cut Rover: The maximum cut that can be attributed to a rover in one update. The maximum amount the machine should be able to cut in one movement.
Max Fill Rover: The maximum fill to be credited to the rover for volumes.
Cut Only Machines: Cut Only machines are machines that perform only cut operations, or only update the surface for cut operations. An example would be and excavator who's cutting edge can be lifted above the surface without filling. Settings for Cut Only machines include:
Min Cut Grid: The minimum cut required to update the surface.
Max Cut Grid: The Maximum cut to be applied to updating the surface.
Max Cut Rover: The maximum cut that can be attributed to a rover in one update. The maximum amount the machine should be able to cut in one movement.
Swing Cut Only Machines: Swing Cut Only machines are machines that do not report the actual cutting edge, but instead send only track positions, and also follow a typical cut pattern based on the pivot point above the tracks and the reach of the cutting edge. Examples include a rope shovel or bucket wheel excavator. Settings for Swing Cut Only machines include:
Max Cut Grid: The Maximum cut to be applied to updating the surface.
Max Cut Rover: The maximum cut that can be attributed to a rover in one update. The maximum amount the machine should be able to cut in one movement.
Include Positions In Reverse For Grid Updates and Volume: When checked all positions will be used. When unchecked positions taken while in reverse will be ignored. This is useful especially in dozer slot pushing when the machines move very quickly in reverse and it introduces noise into the data.
Include Positions While Rotation For Grid Updates and Volume: When checked all positions will be used. When unchecked positions taken while the machine is rotating in its tracks will be ignored. In cases where offsets are applied to the updates a rotating machine can make bad updates.
Use Cross Slope: Updates are applied on a line the width of the machine. When checked the tilt is applied to the line when updating the surface. When not checked, the line is kept level.
Rover Offset Settings
Each machine has a set up for Forward and reverse surface update offsets.
Rover Offset Settings
Current Forward Motion Offset: In blue shows a line at the current position on the machine where the surface is updated. For Example, this is useful for updating the surface at the blade for a dozer, or at the front axle of a landfill compactor.
Current Reverse Motion Offset: In green shows a line at the current position on the machine where the surface is updated when in reverse. For Example, this is useful for updating the surface at the antenna for a dozer, or at the rear axle of a landfill compactor.
Additional Settings
Protools Additional Settings
Max Distance: The maximum distance between two points before the movement between them is considered broken. If the distance between two points exceeds this number, no line or movement will be counted between them.
Max Time: The maximum time between two points before the movement between them is considered broken. If the time (in seconds) between two points exceeds this number, no line or movement will be counted between them.
Override Daily Grid Limiter: If a site has not run for a long time eventually Protools will stop putting out duplicate grids every day. This overrides that limiter.
Additional Output: Additional daily outputs from protools.
Diff Grid: A surface that is the difference in elevation between the previous day and the current day.
Change Grid: a surface that is only the nodes that changed between the previous day and the current day.
Once finished configuring settings either press "Configure Service" to start a Protools Service run (Service runs will be run every 15 minutes and update the grids as new data becomes available), or perform a one time run by pressing "Run."
Daily Email
Check users to subscribe them to a daily email of the final surface output of Protools for their site.
Daily Emails
Output
Go to the File Browser to monitor the progress or to download the output grids.
Timeline
Time events for each machine are displayed on a line. Time events are things like movement, idle time, activities, delays or down codes.
Timeline
The Action line is the top line on the timeline for the machine. This line shows the machine's name and displays a colorized representation of the movements of the machine. Green represents moving time, yellow idle time and red GPS down time. Limits for moving and idle can be found under Site Management → Limits.
The next lines each represent a specific kind of data.
Operator Line: This line shows which operator was logged in.
Project Line: This line shows which project was loaded in Carlson Grade.
Operational Codes Line: This line shows if an activity, delay or down code (off-time only) was active in the system for this time.
Controls:
The primary controls for the timeline are in the left panel and allow showing a time span with a starting point.
Timeline Controls
Range Start: The point in time to begin the timeline.
Range Span: (and time units) Sets the amount of time and in which time units to display the timeline.
Note: The timeline can be zoomed in or out with the zoom buttons or with a Shift+Mouse Wheel.
Fleet Tree: Below the zooms is the Fleet tree. Select from fleets or machines to be displayed on the timeline.
On Timeline Functions: Selecting a time range on the line displays details about the timespan. This includes the type of operational code and what is selected as well as the start and end times of the timespan.
Timeline Functions
Edit the operator and operational codes from this menu. Select the timespan to edit and then choose from the available options in the drop down menus.
Time spans for operators and operational codes can also be 'split.' Select the timespan and press the Green plus button to insert a split. Choose a time for the split and the new activity will begin at the time chosen. Select the same activity on two timespans to combine.
KPI (Key Performance Indicators)
Press the KPI button in the header to go to the KPI page.
The KPI page is available in the Landfill, Pile, and Drilling modules.
The KPI page is a reporting dashboard where users can configure reports based on industry specific metrics. The charts configured on the KPI page are shown on the KPI tab of the Details panel on the Command map view page.
The charts are arranged as created in 2 columns.
Press the data button in the upper right corner to see the values in tabular format.
All KPI pages have a control panel at the top
Settings - Open the left settings panel.
PDF - This button produces a PDF report of all charts and data configured on the page.
Dates - Configure the date range to run the reports
Breakdown - Choose the time increment to break down the reports
Day
Week
Month
Apply - Apply the settings and run all of the configured reports.
Add - Located on the right side of the control panel.
This button adds another chart to the page.
Press the gear icon in the upper right corner to open the configuration of the new chart tile.
Change the title by editing the “Key Performance Indicators” text at the top of the configuration menu.
Press the Add icon to add a new metric. There are a variety of ways to display the metrics.
Breakdown - This will convert the chart to a single metric and show all the value for each site checked in the left panel “Sites” tab.
Axis - Display the values on the vertical axis for this metric
Trend - Adds a trend line to the chart at the time breakdown value
Style - How the metric will be represented on the chart
Bar
Line
Point
Color - The color of the metric’s representation on the chart
Delete - Delete this metric from the chart.
Settings Panel
The settings panel has 2 tabs.
Charts
This tab contains a tree listing the Charts. Uncheck them to remove them from the view.
Sites (Command Center Users Only)
The Sites tab contains a tree of all sites the user has access to. This table is only applicable to “Command Center” users who have access to multiple sites.
The current site is checked by default. Other sites are added to the charts by checking them. This stacks all of the values from each site into the metrics of each chart.
For example if site A has 500 piles driven for a day, and site B has 500 then the piles driven for that day will equal 1000.
The Breakdown feature on each chart shows just that metric broken down by site.

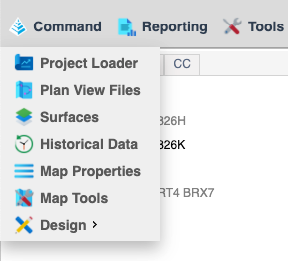
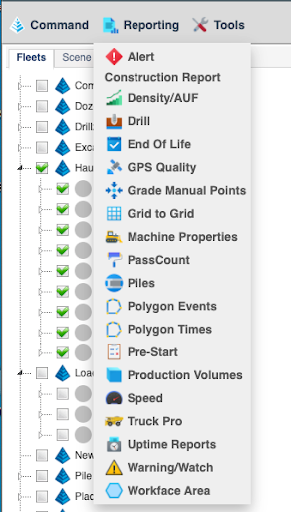
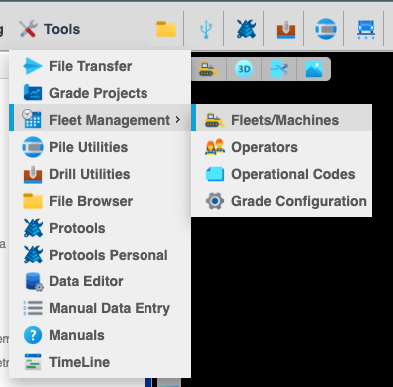
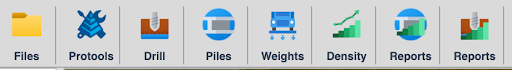
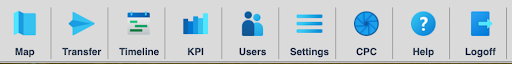
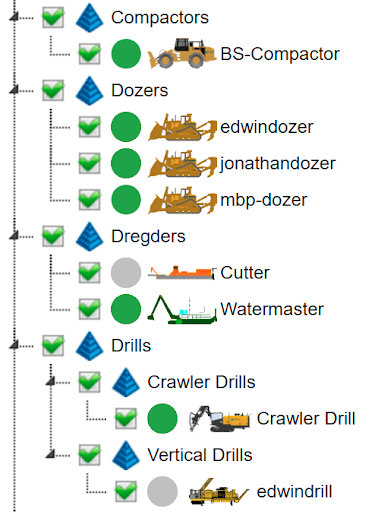


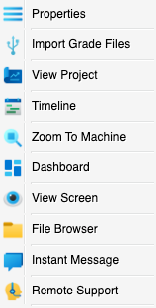
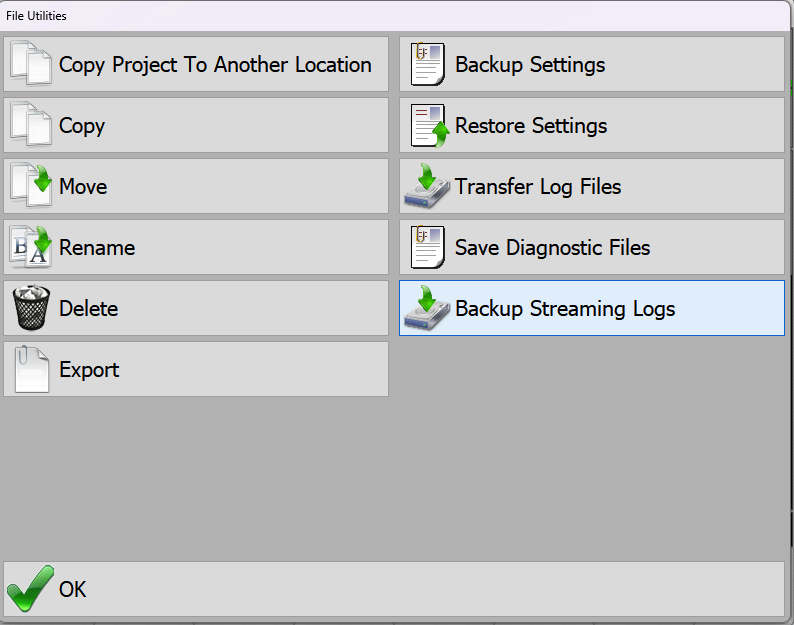
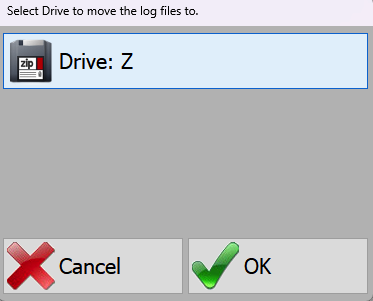
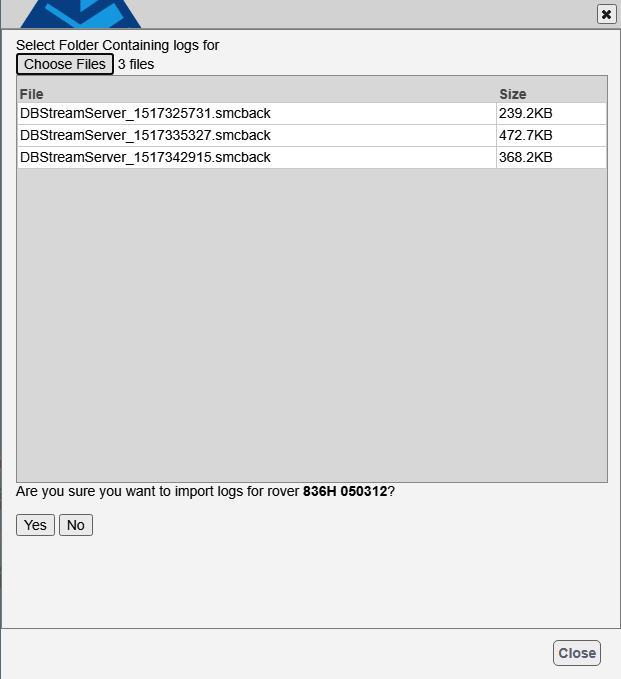
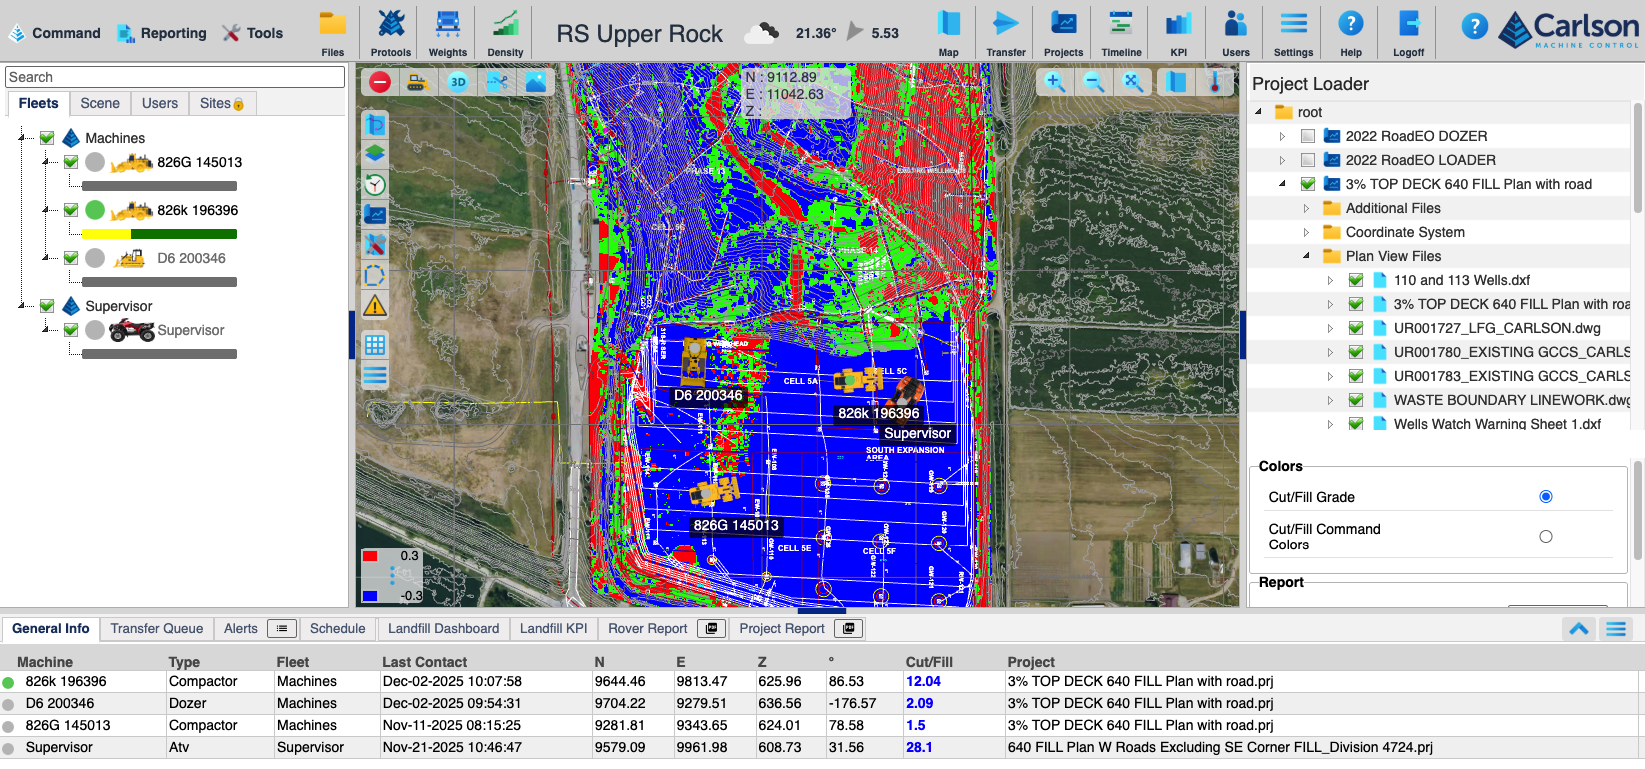
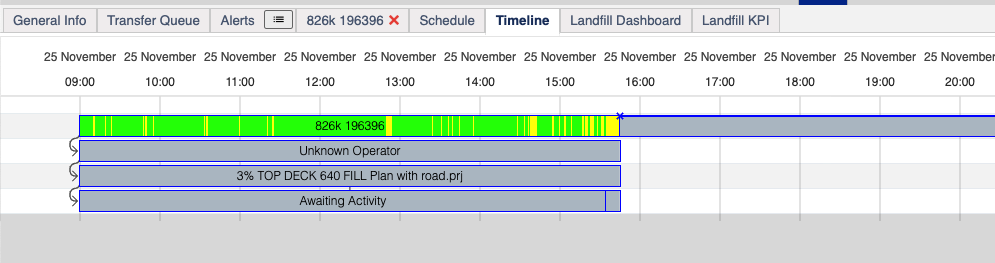
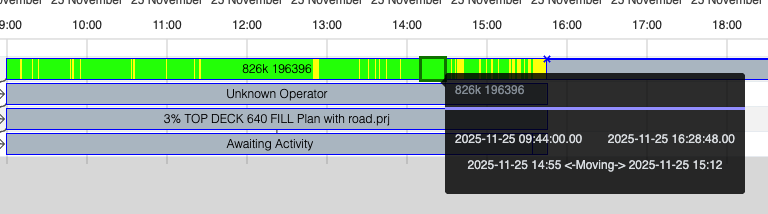
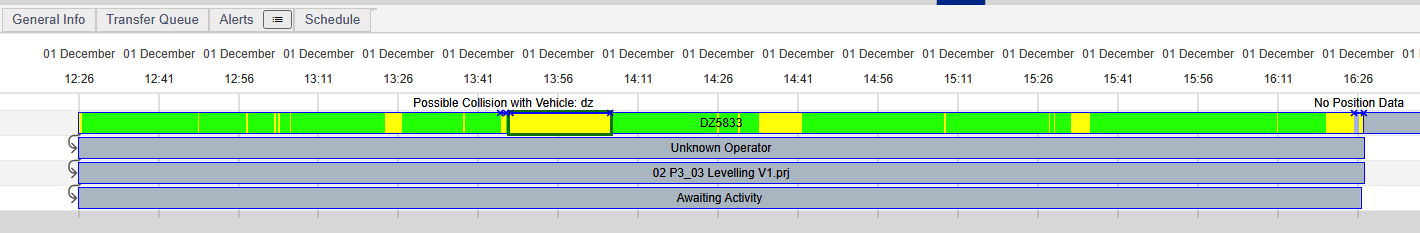
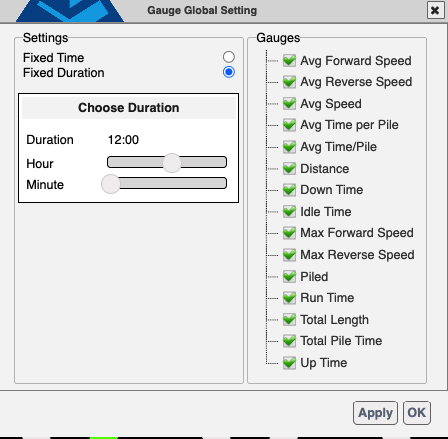

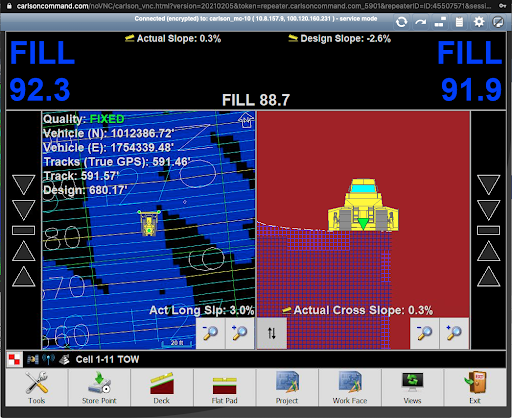
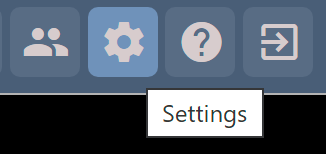
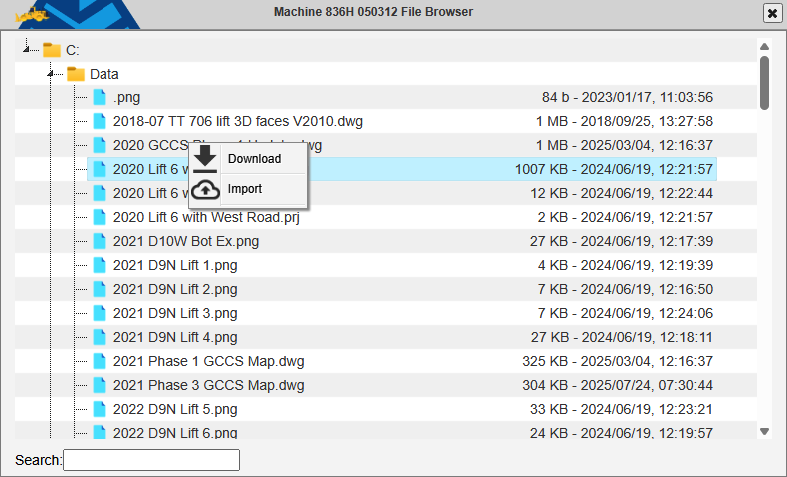
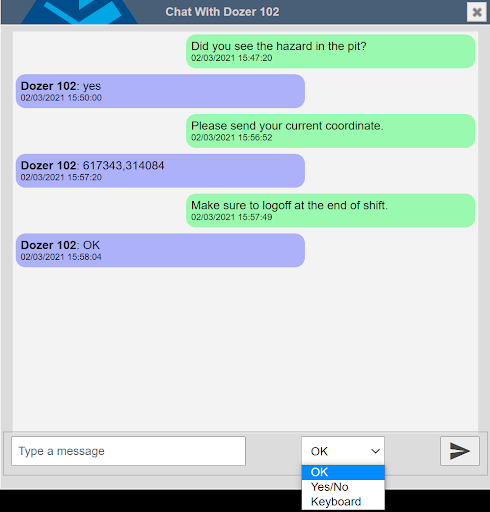
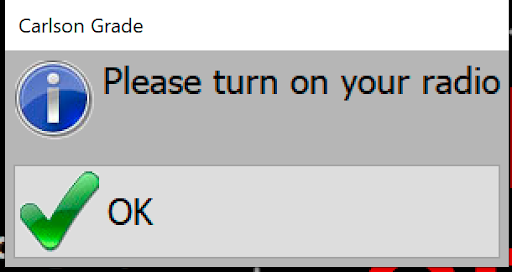
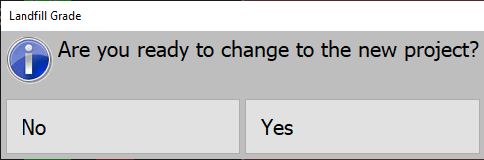
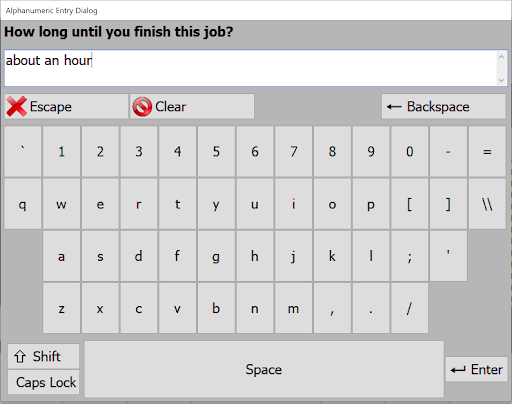
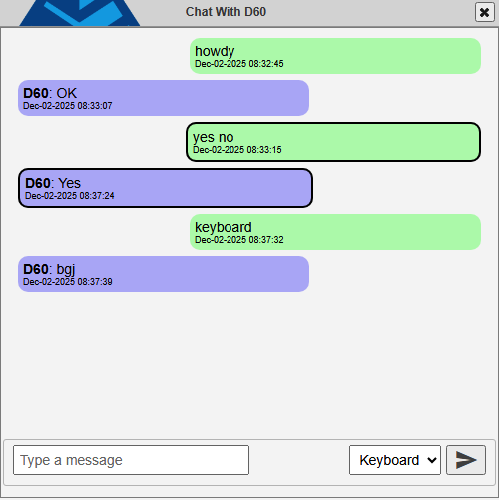
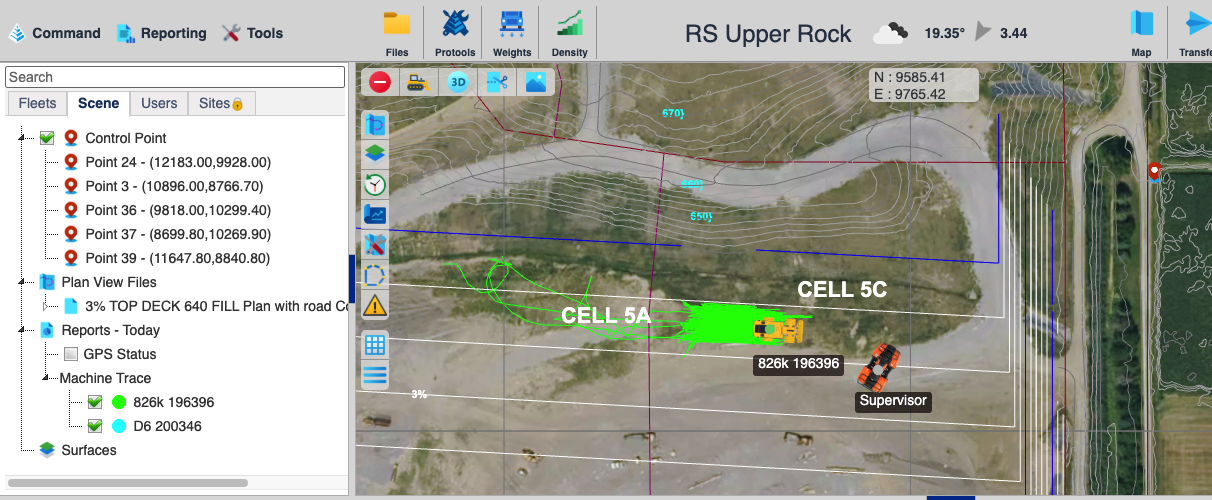
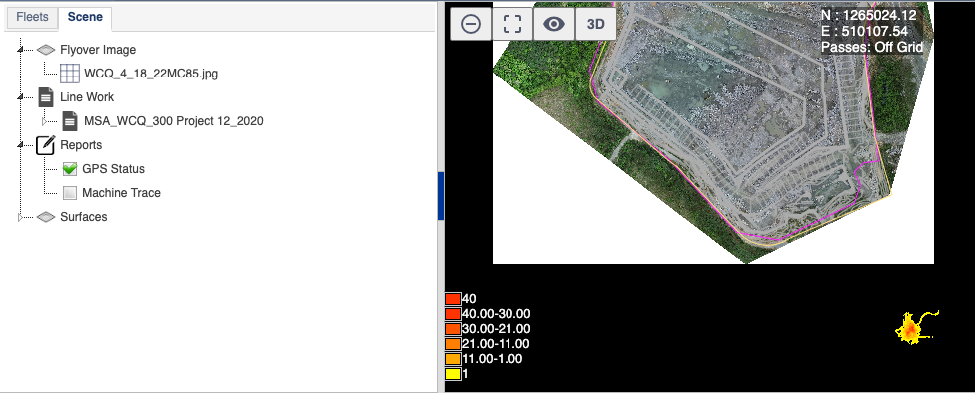
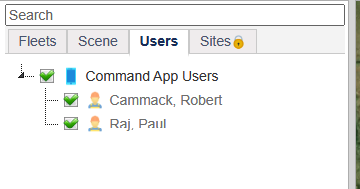
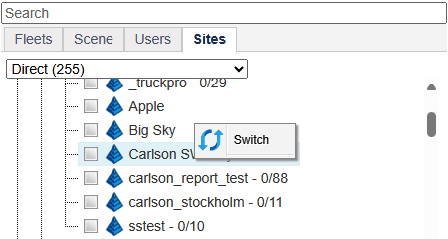
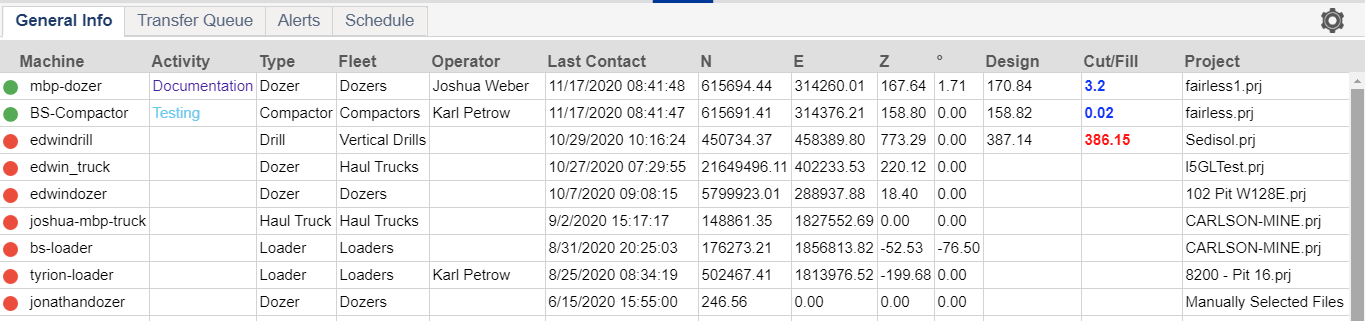

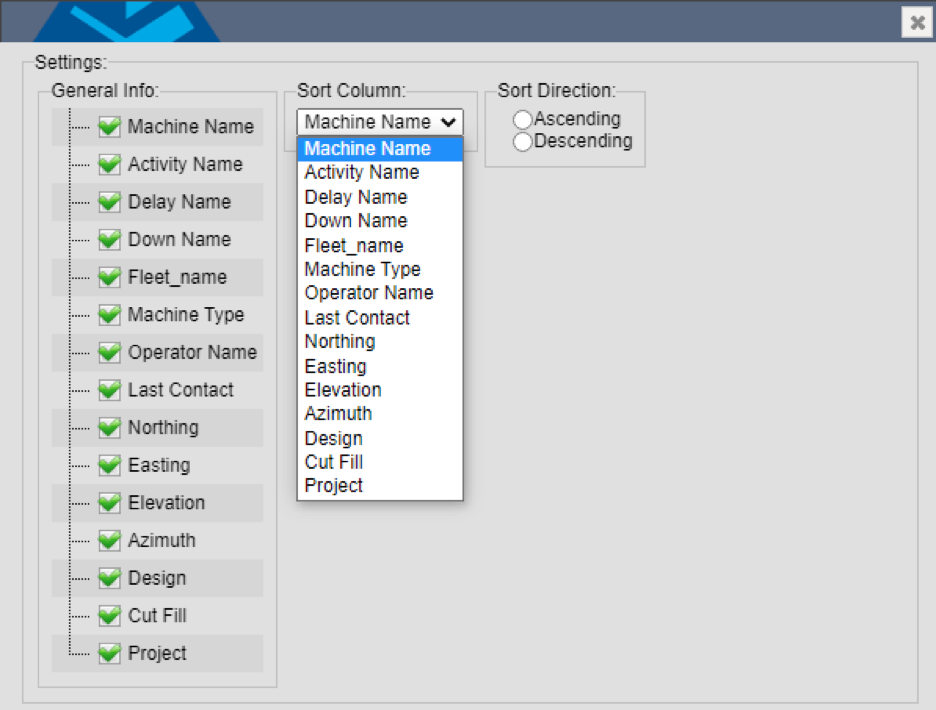
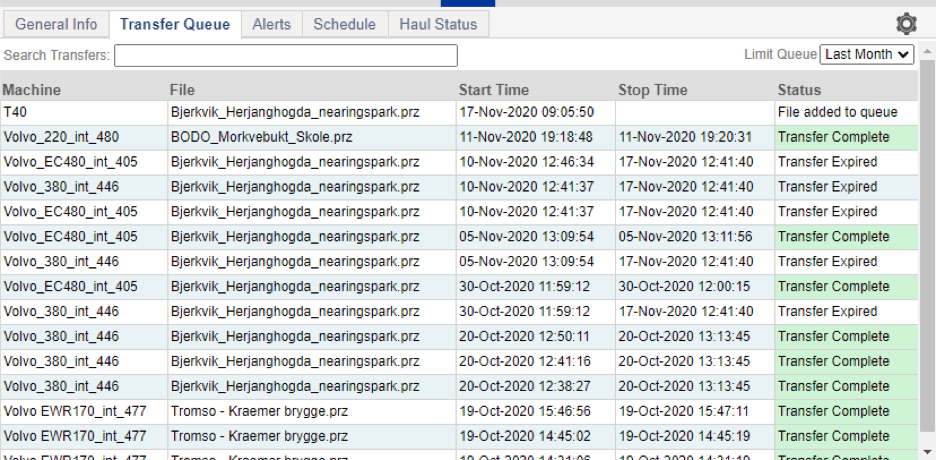
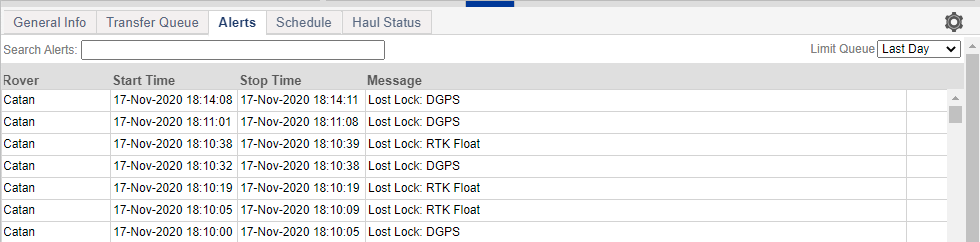
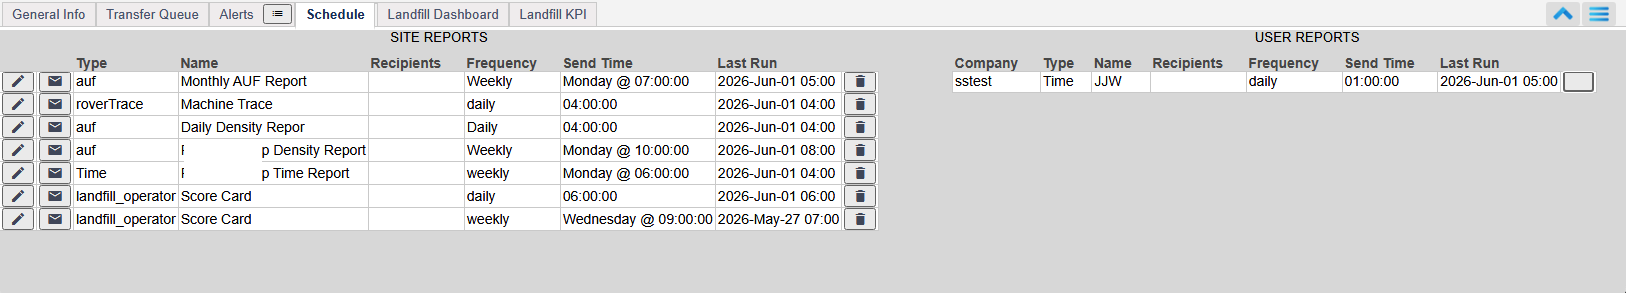
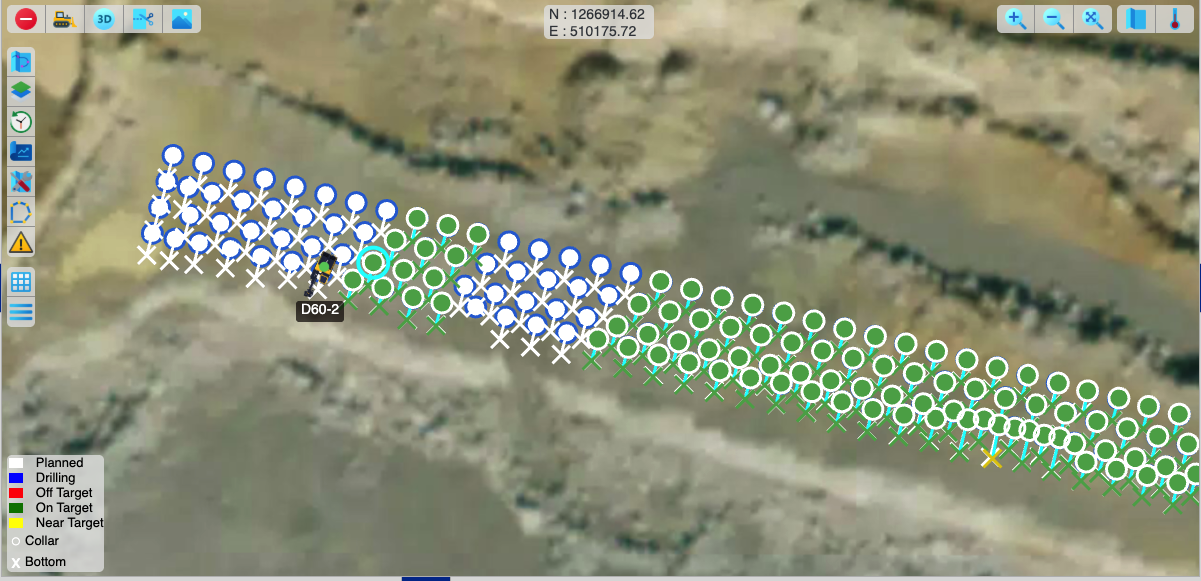
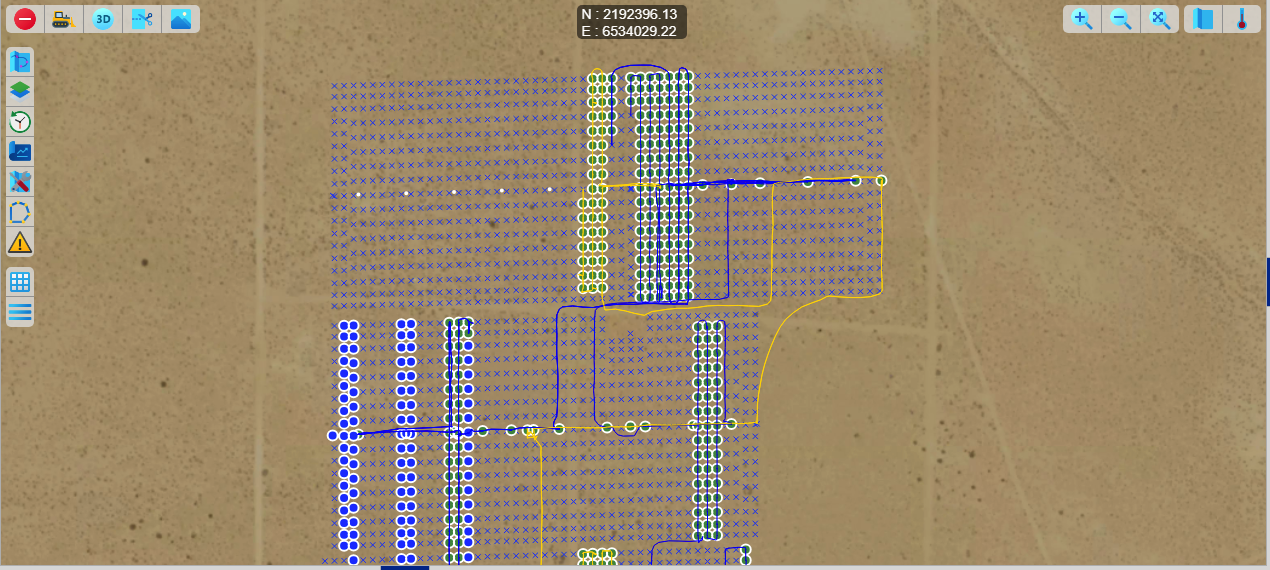
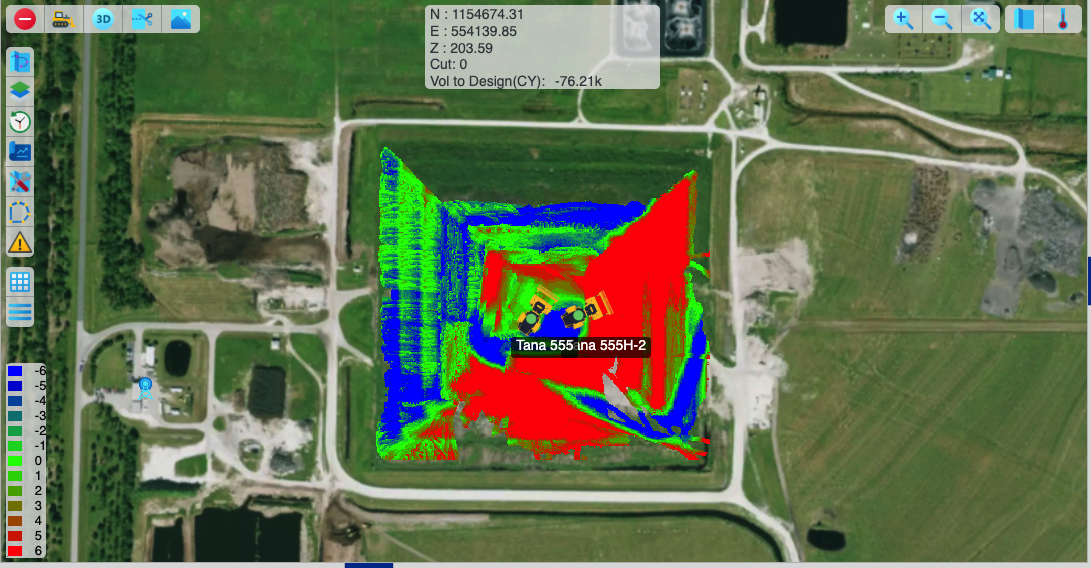


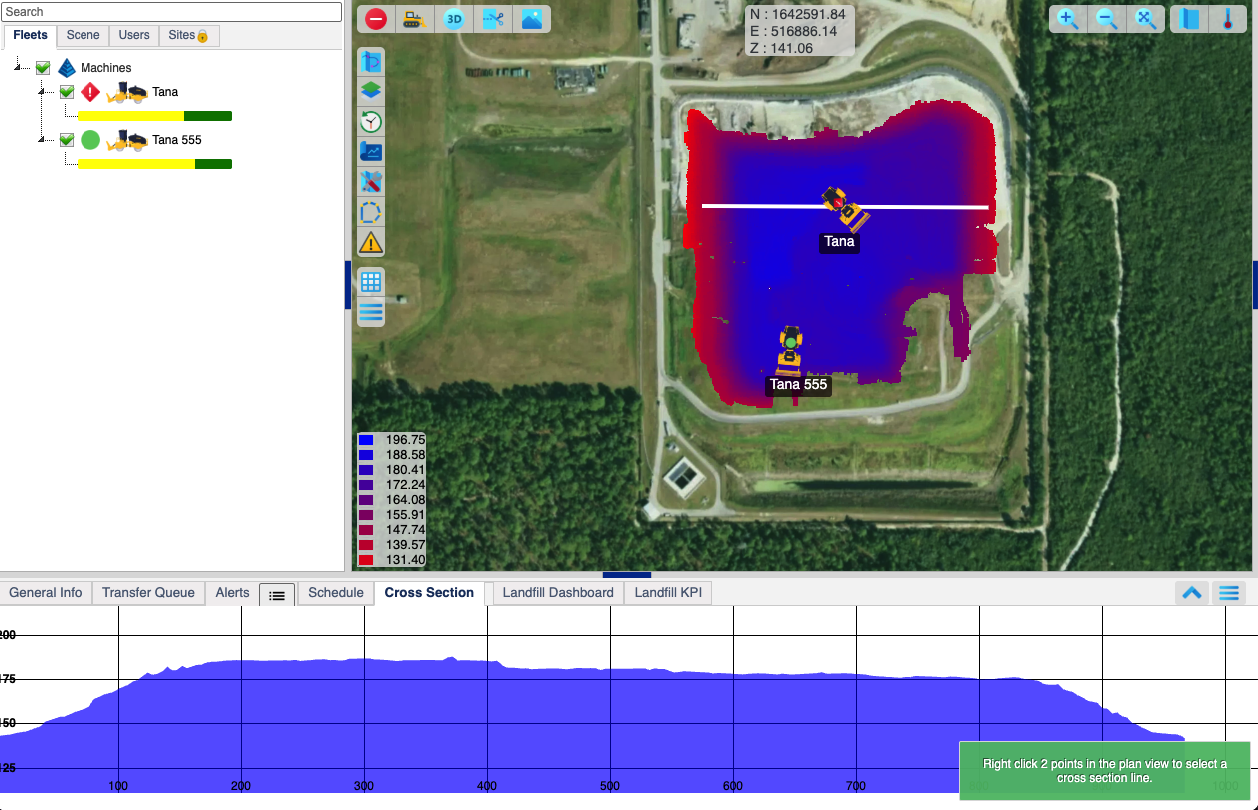


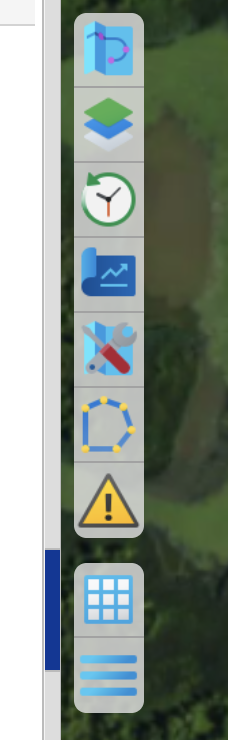
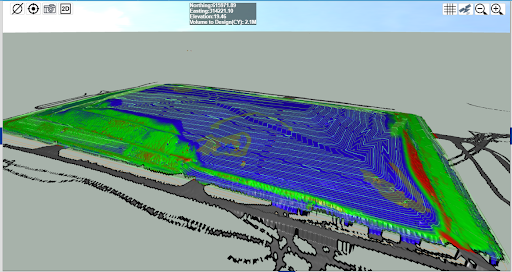
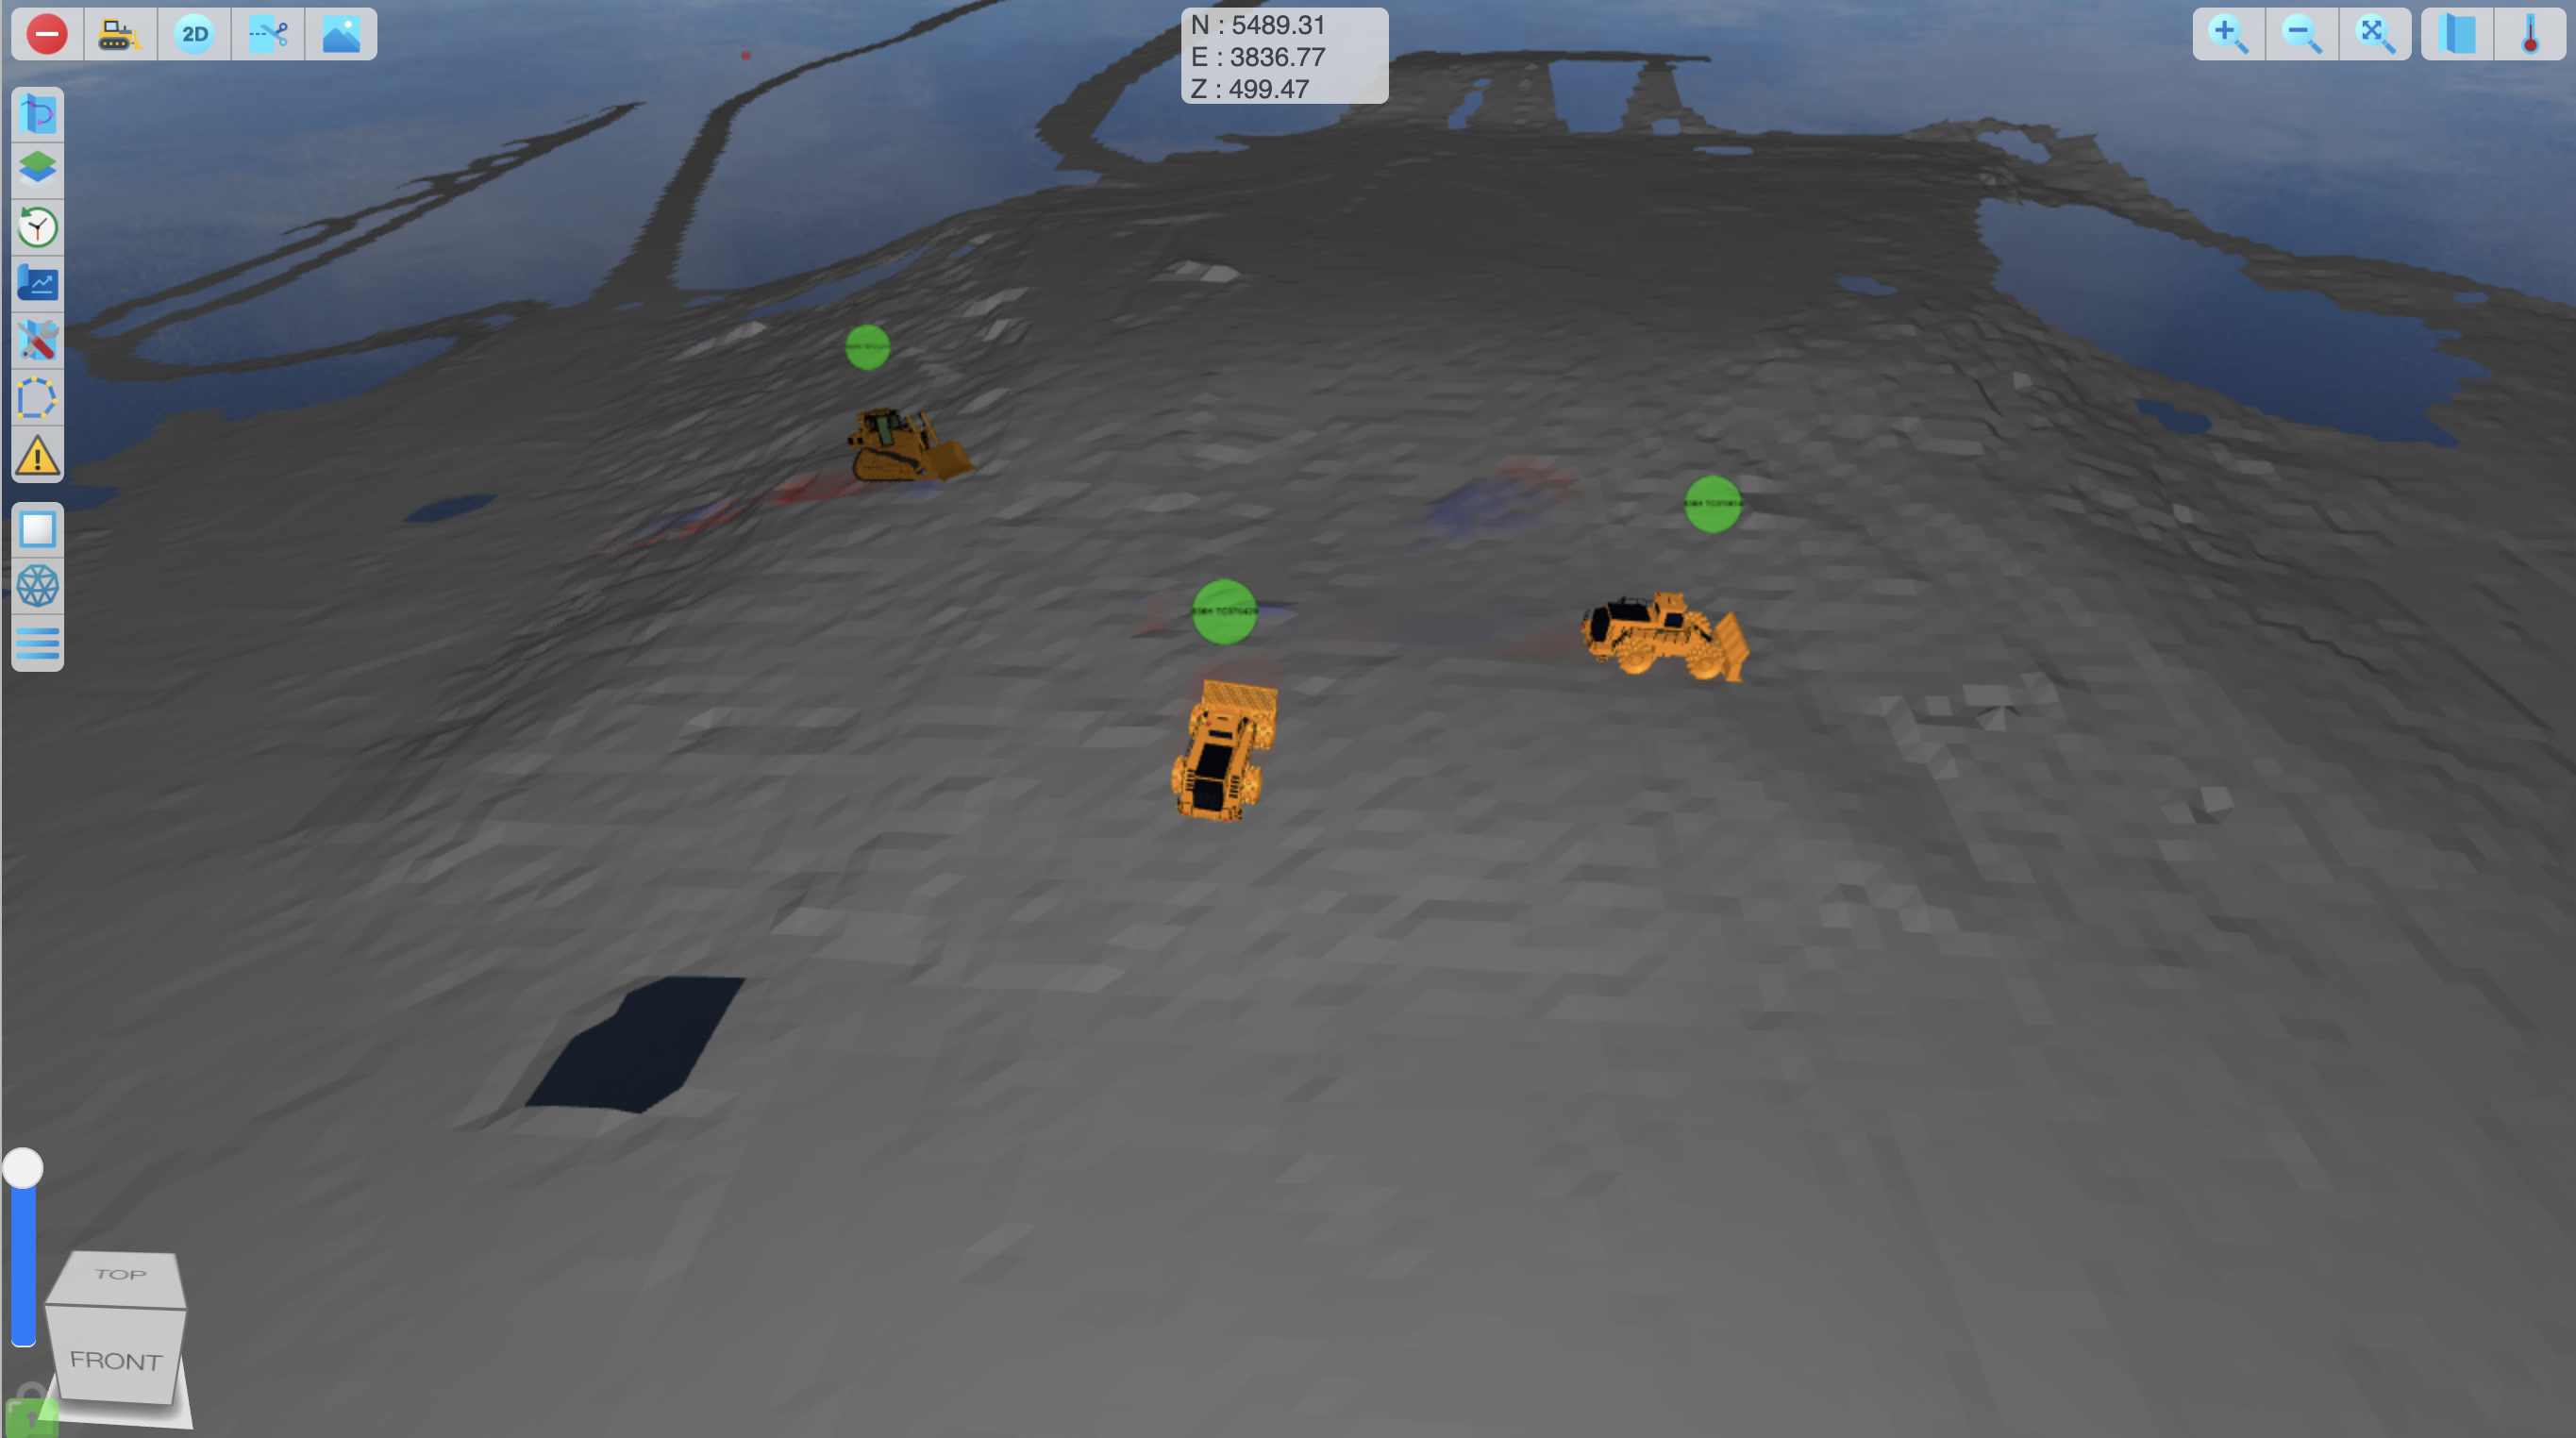

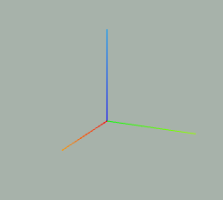
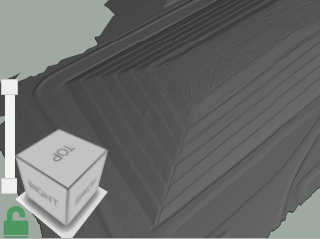
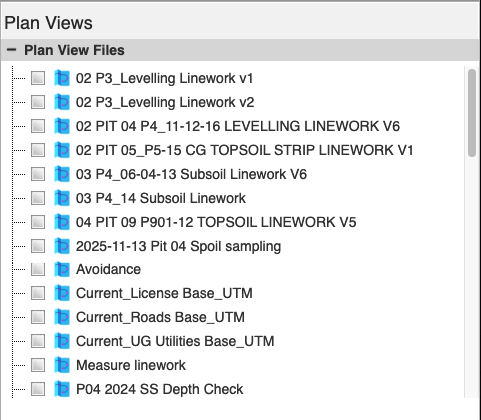
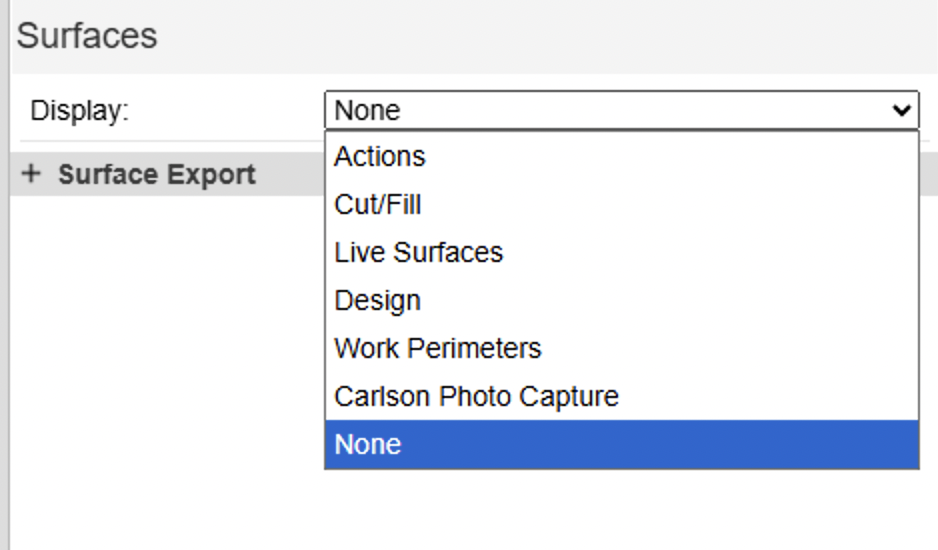
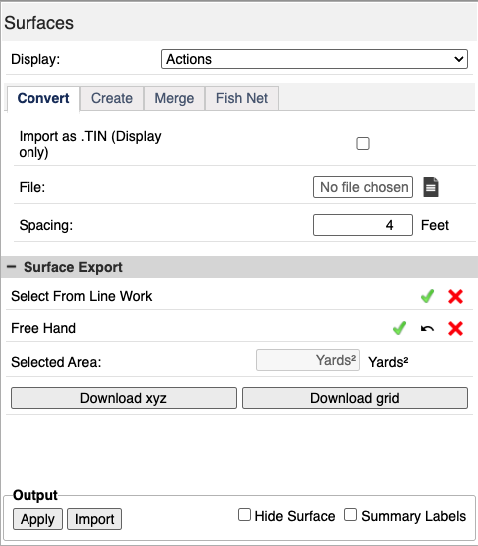
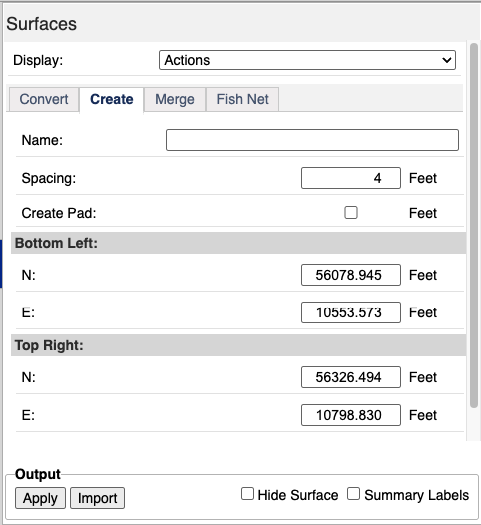
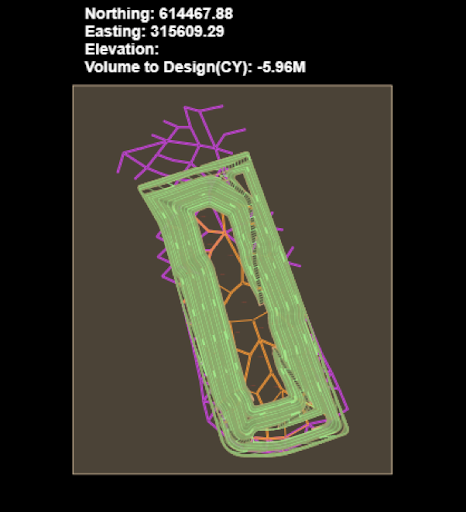
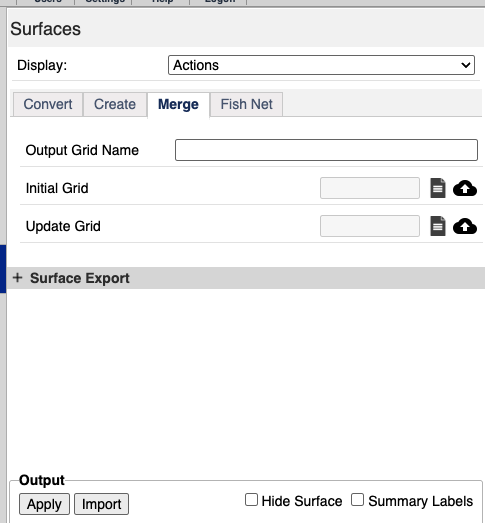
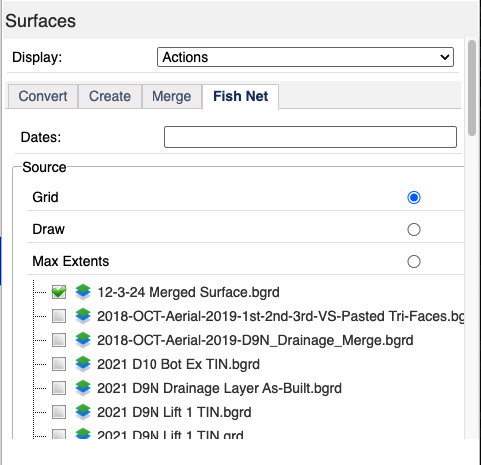
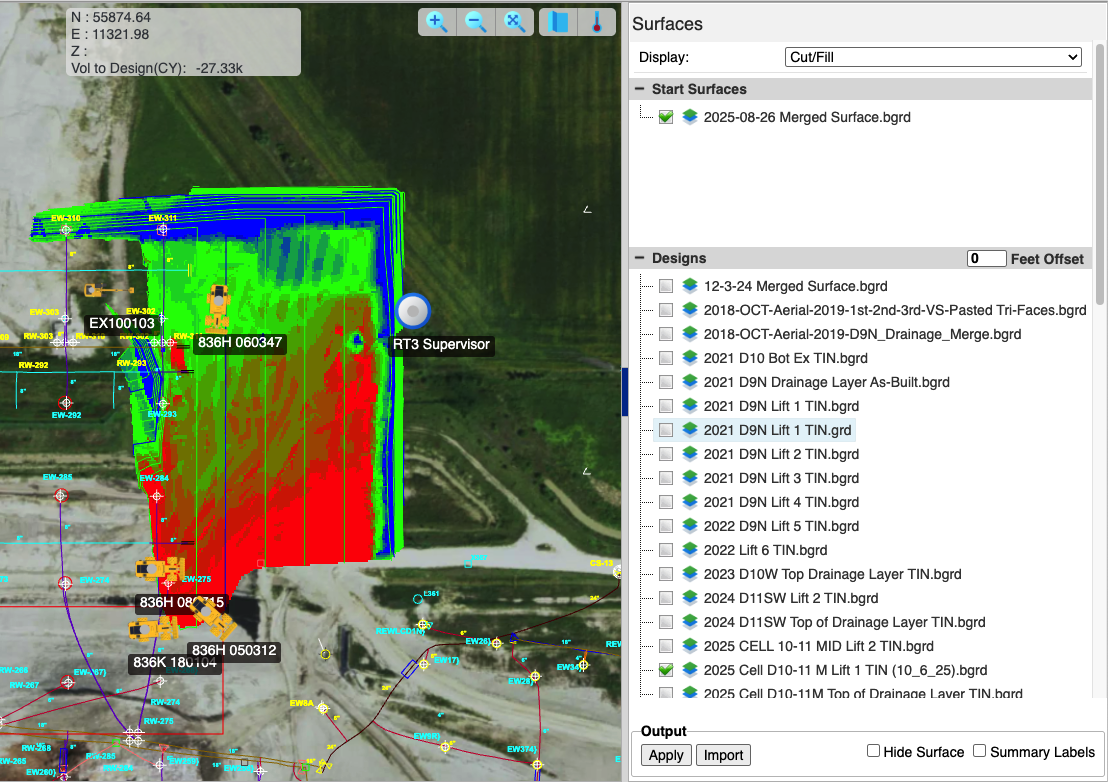
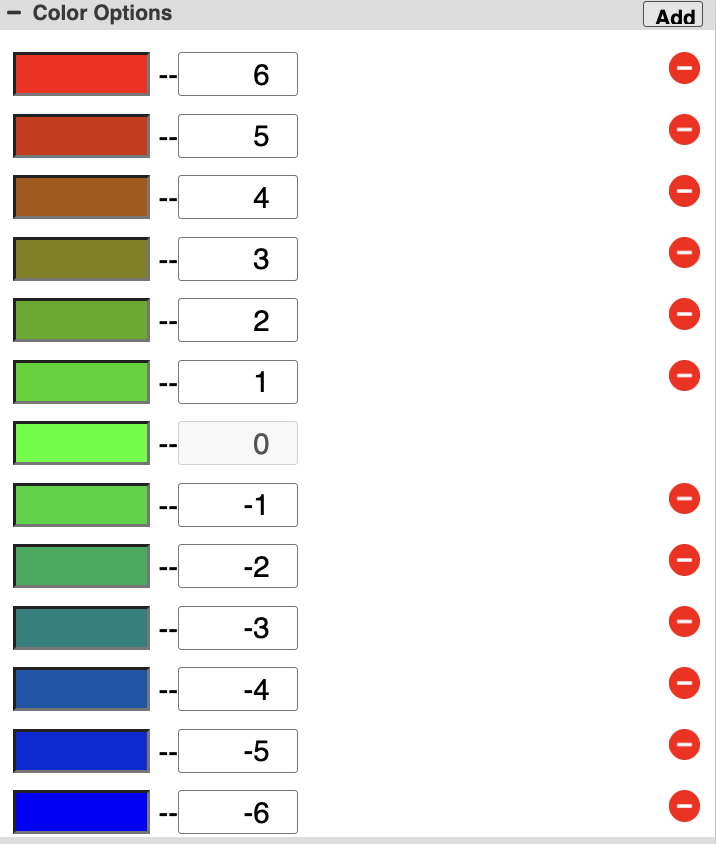
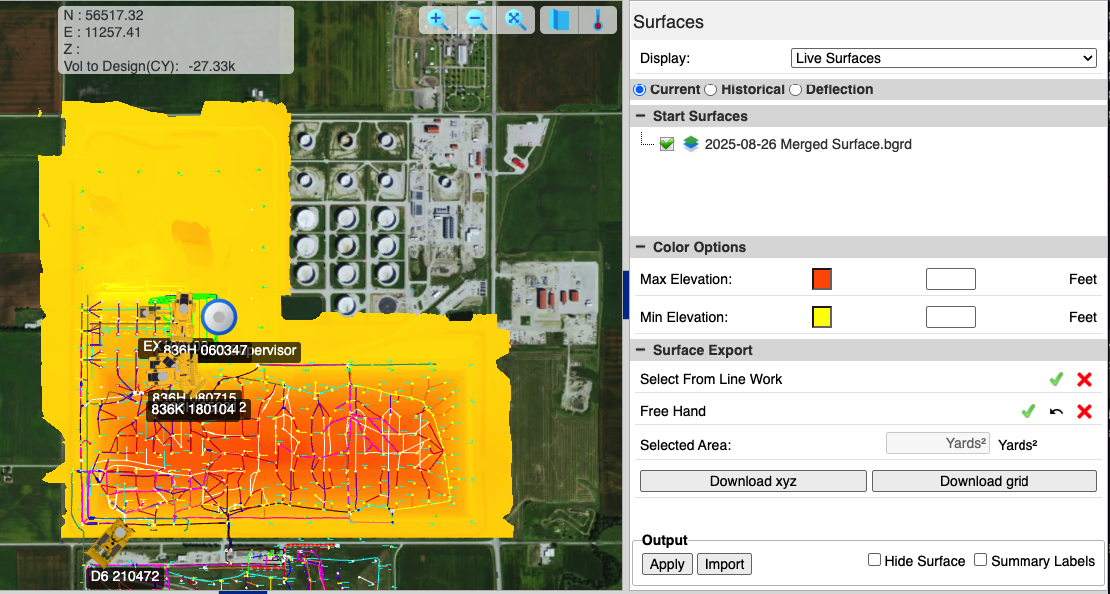
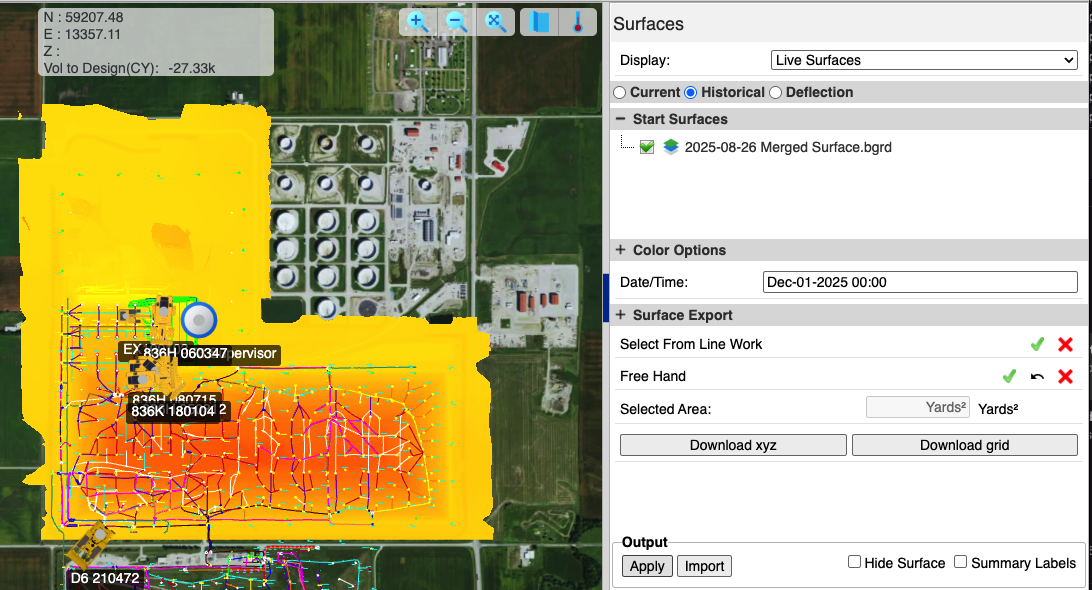
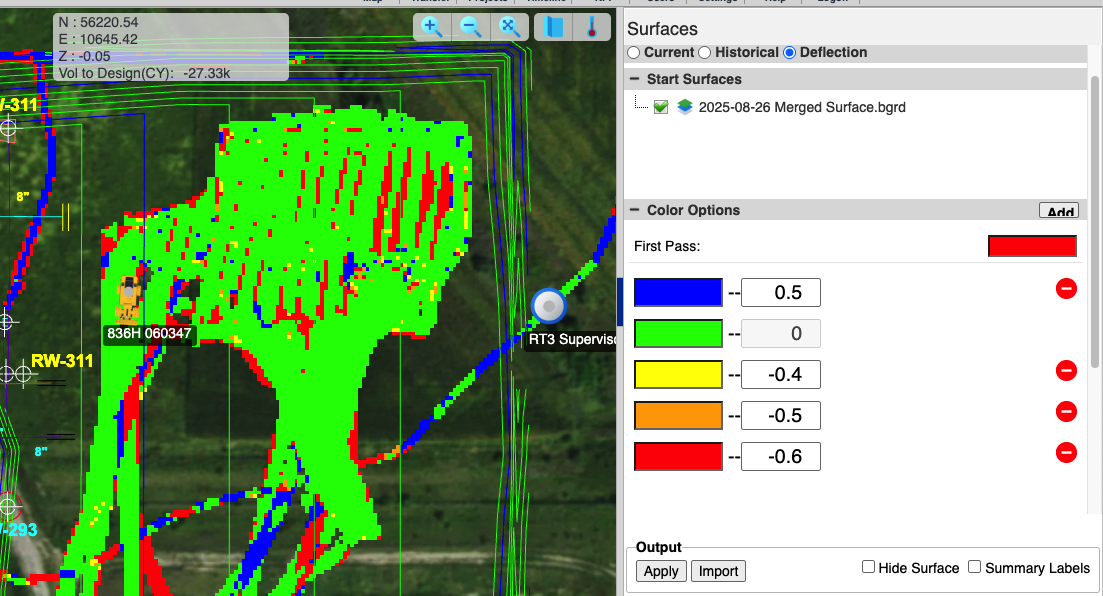
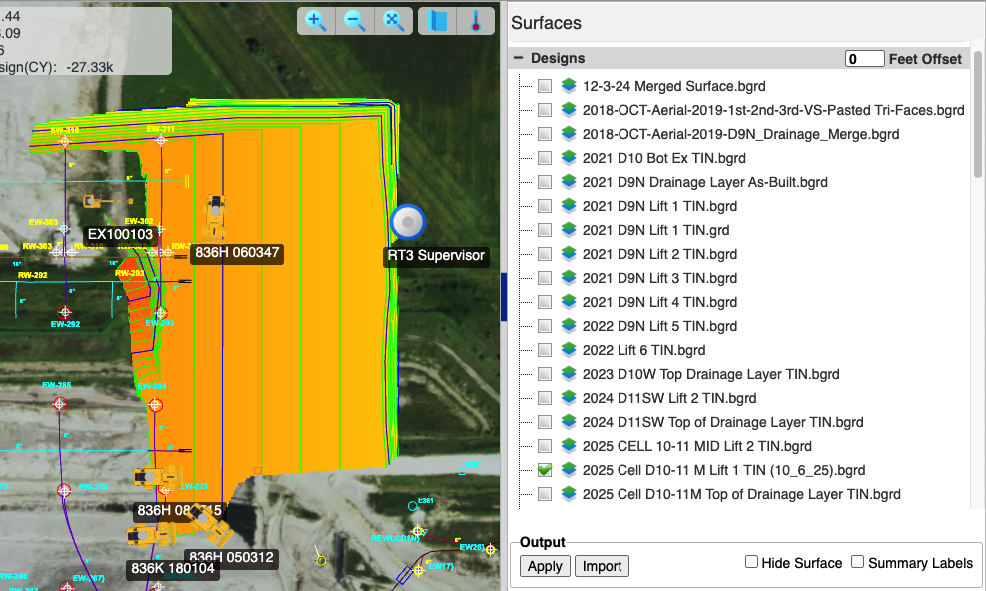
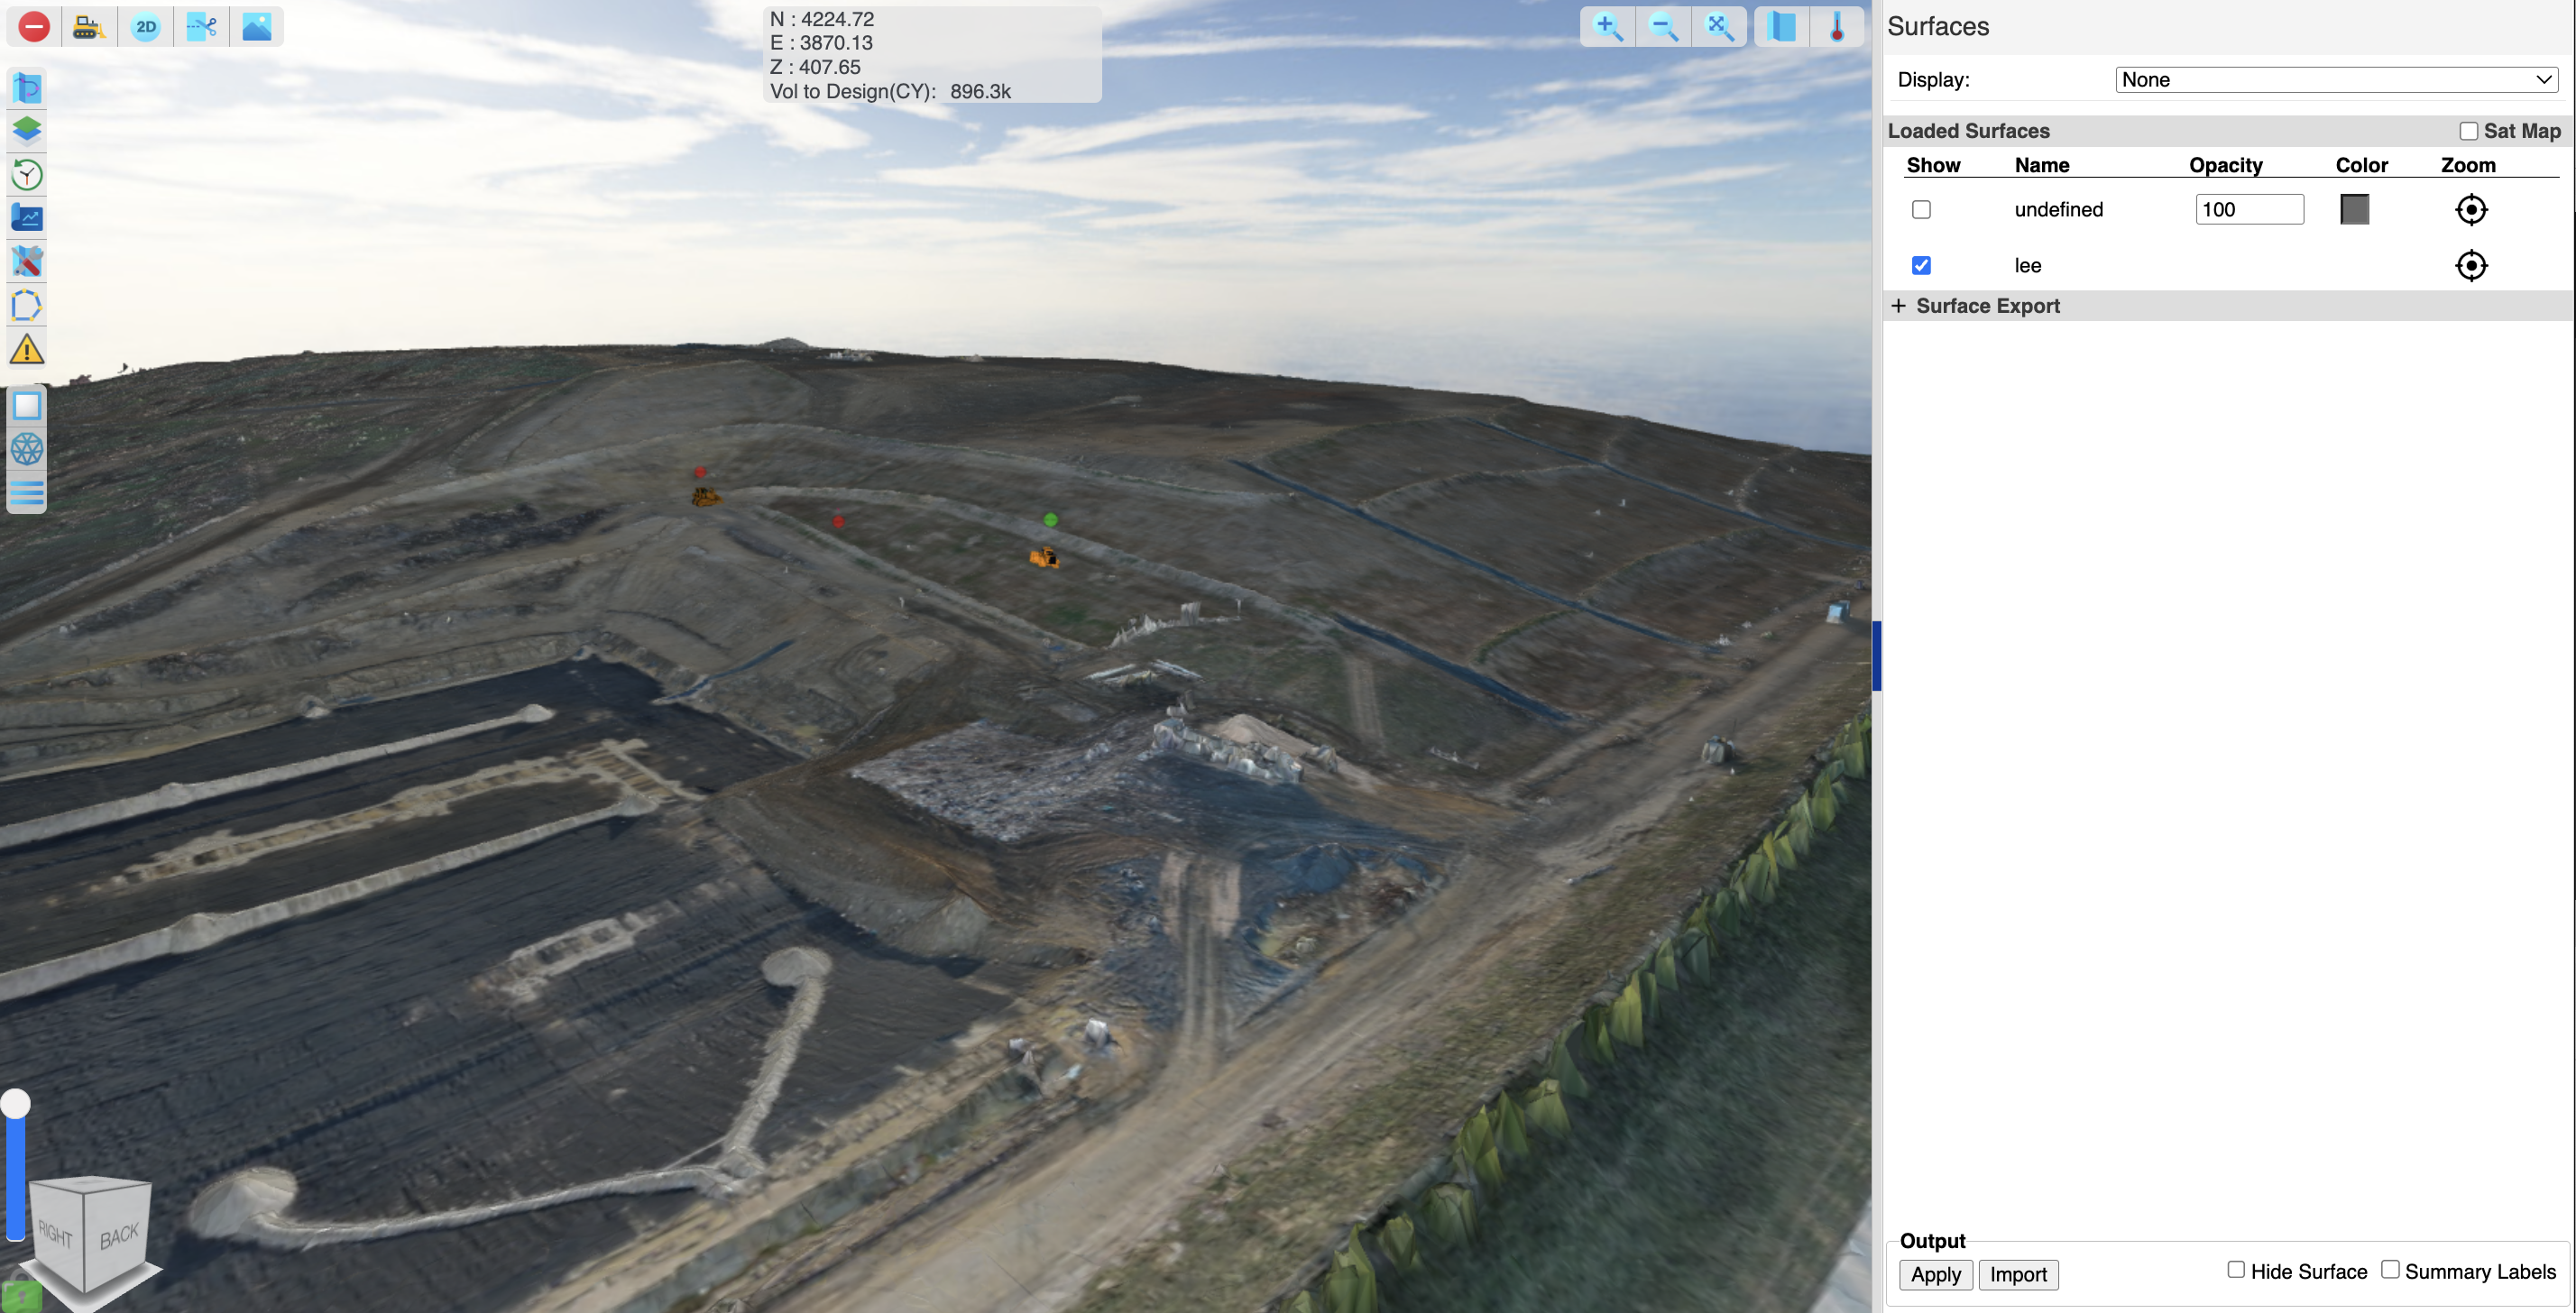
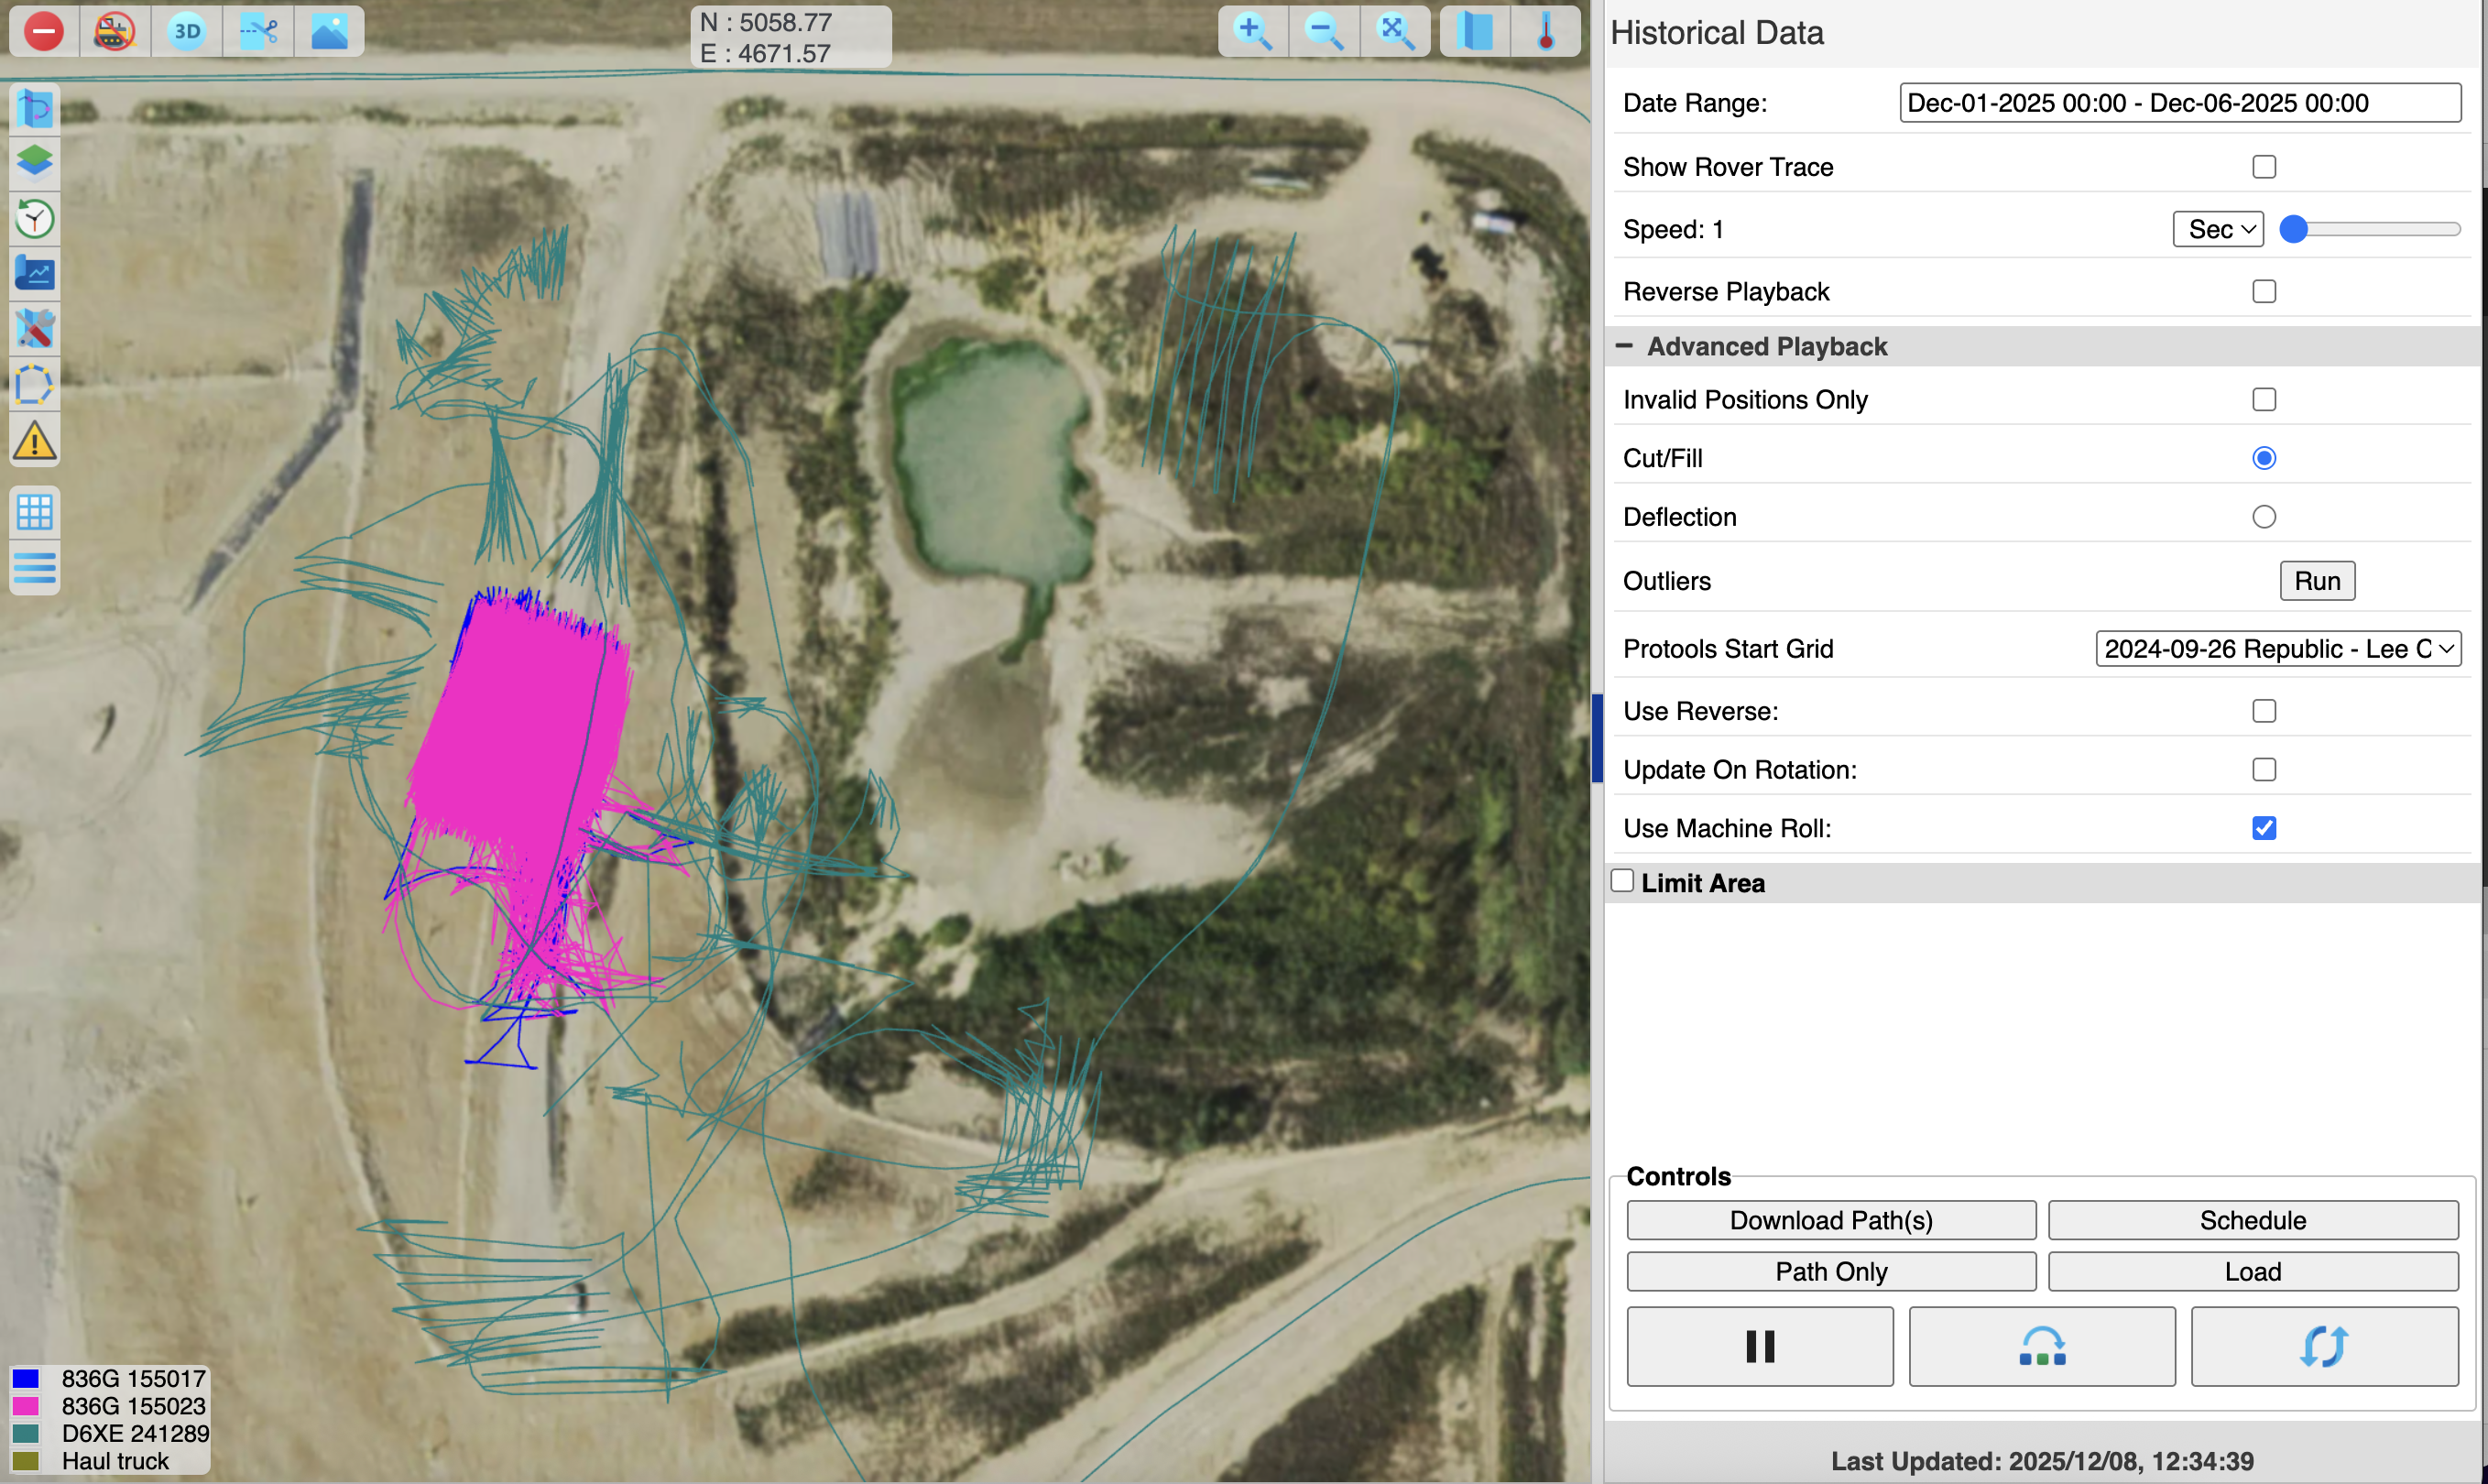
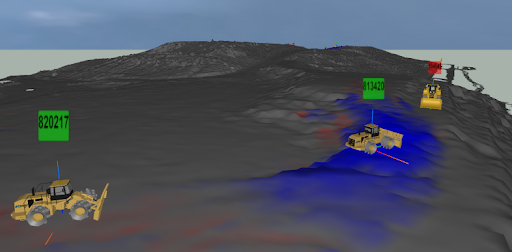
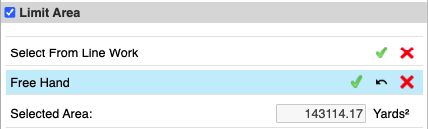
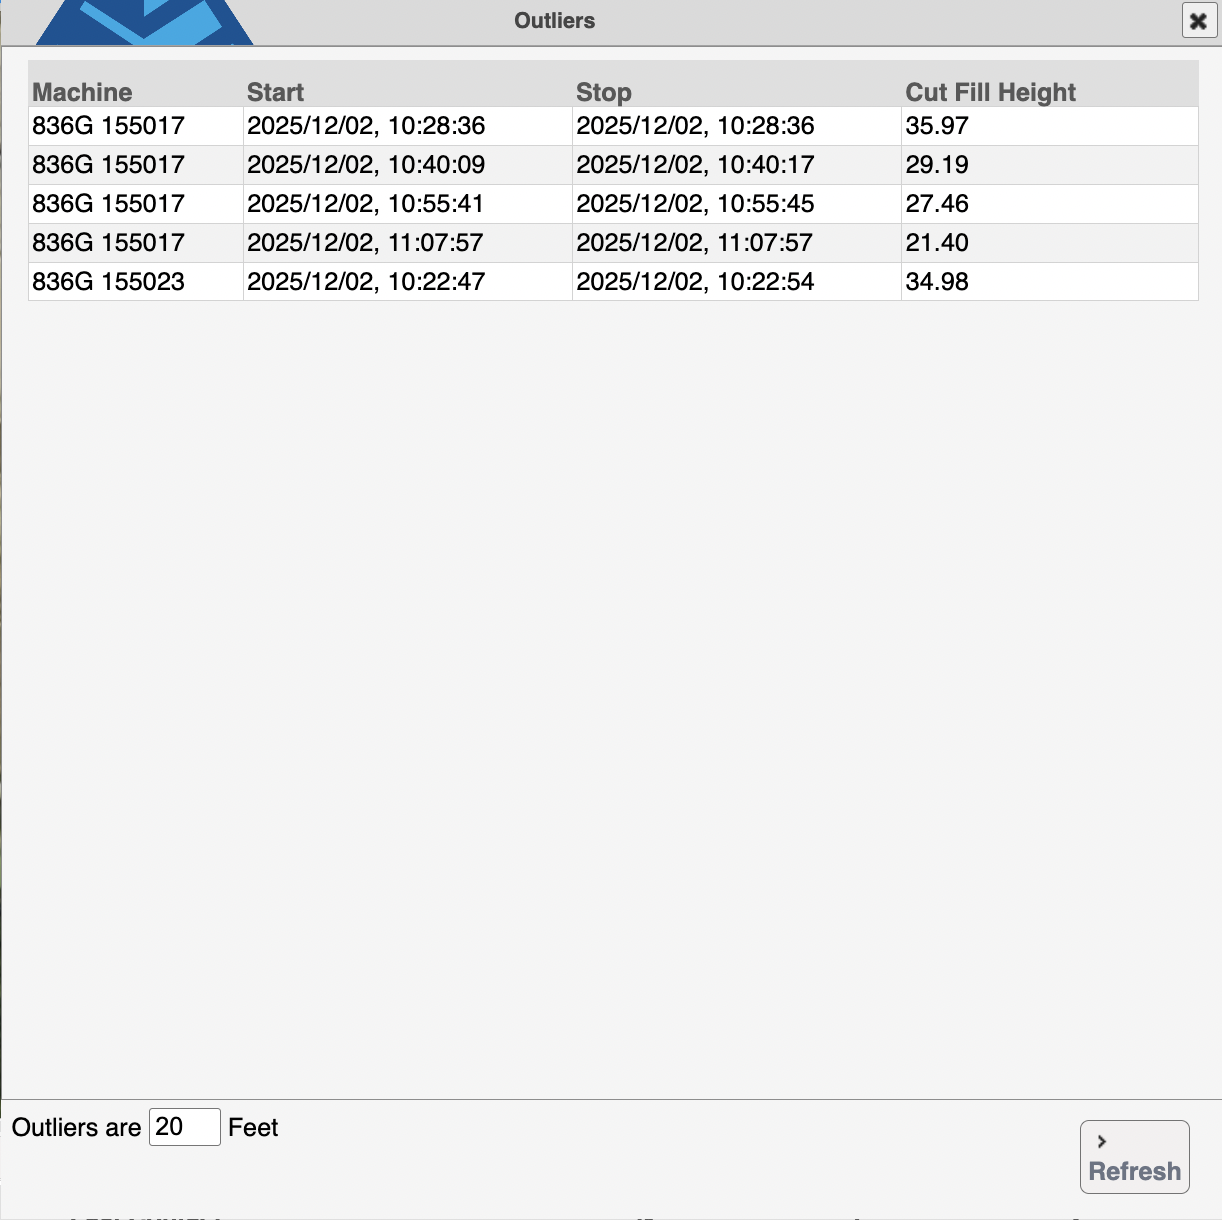
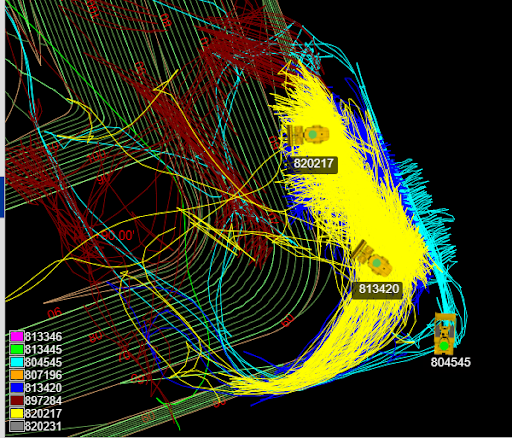
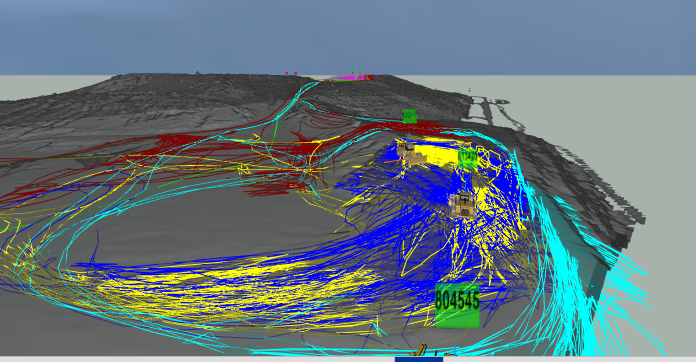
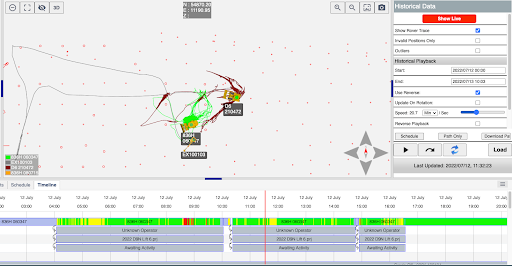
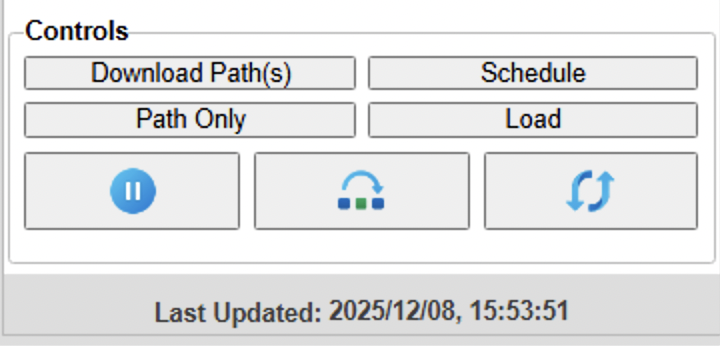
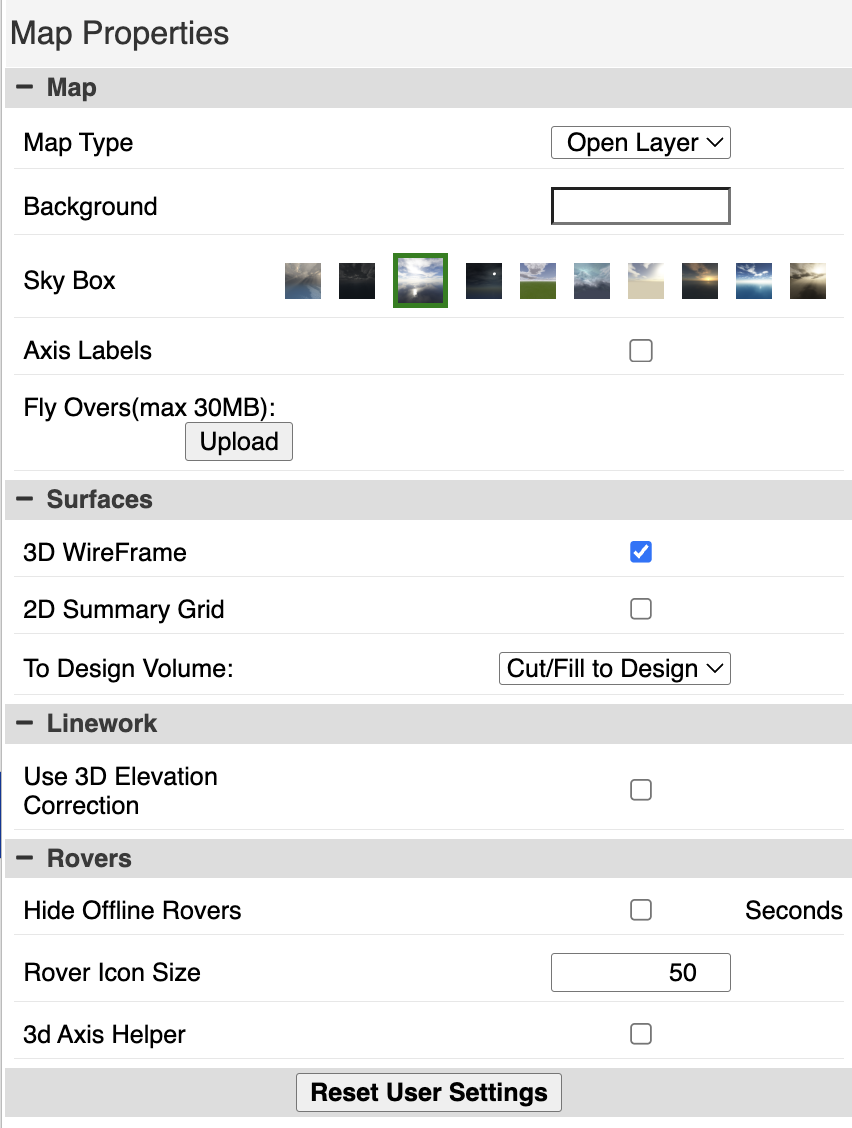
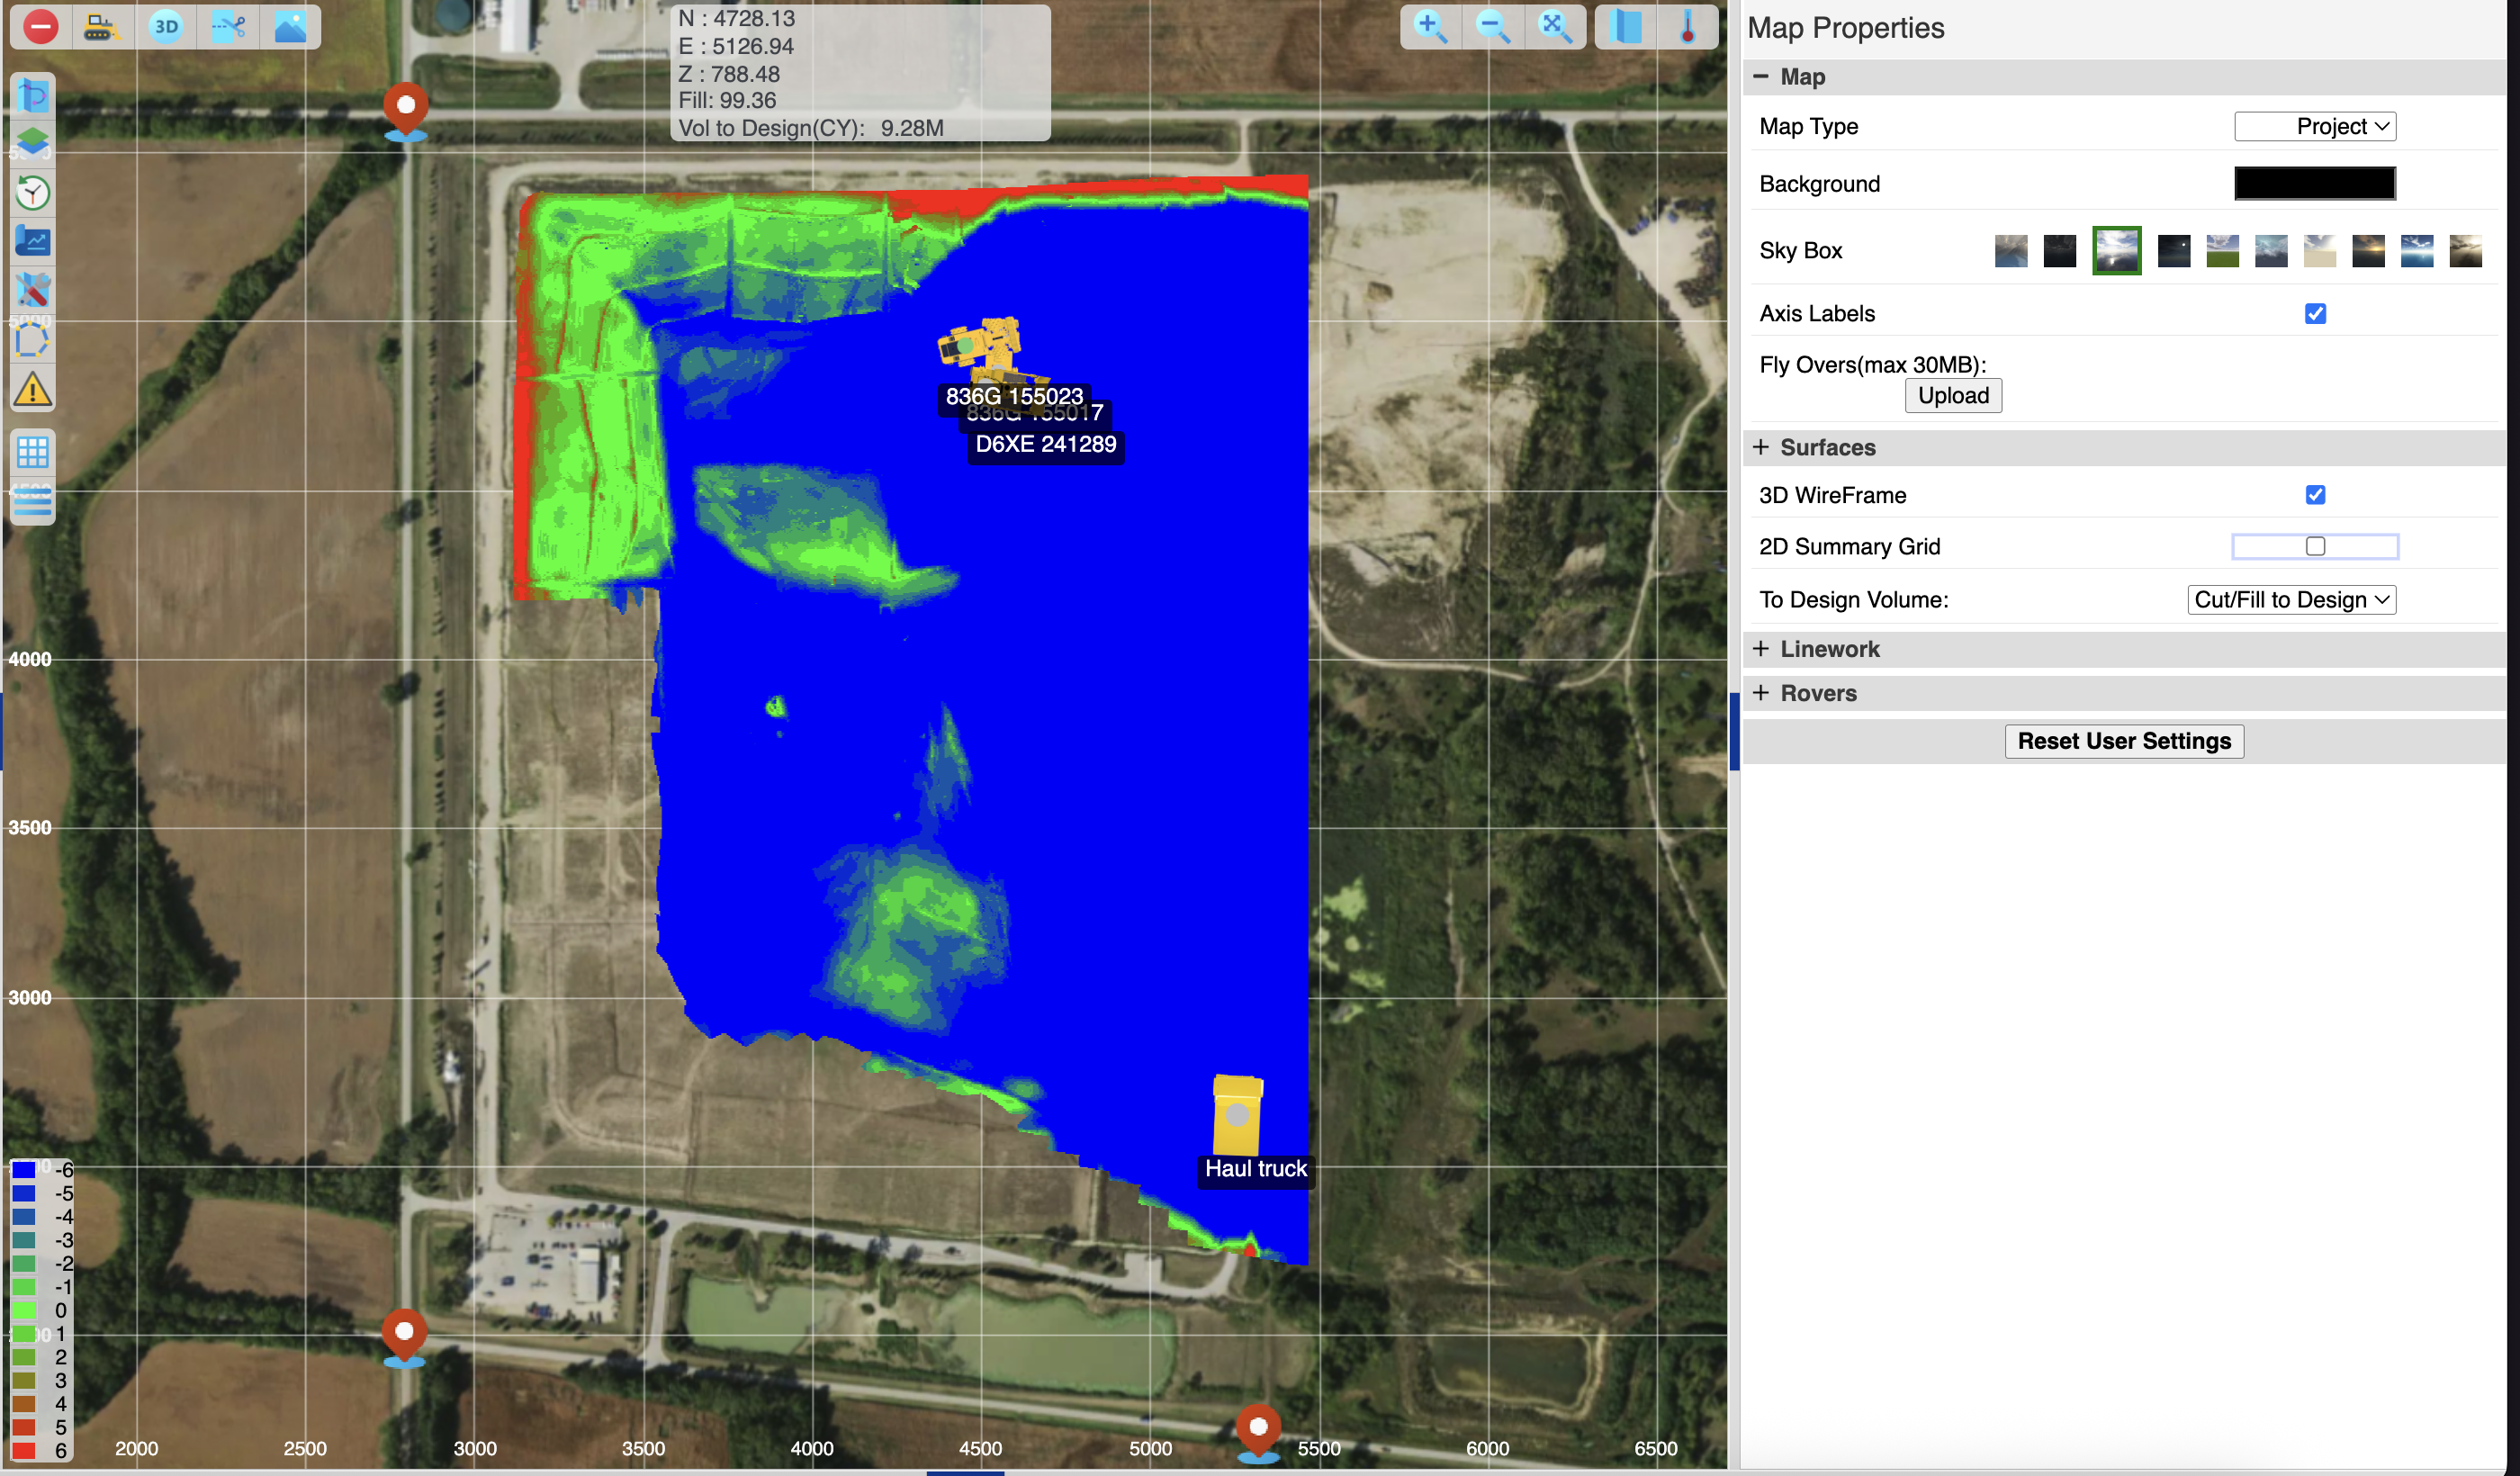
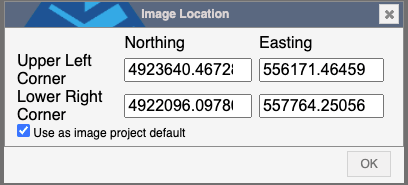
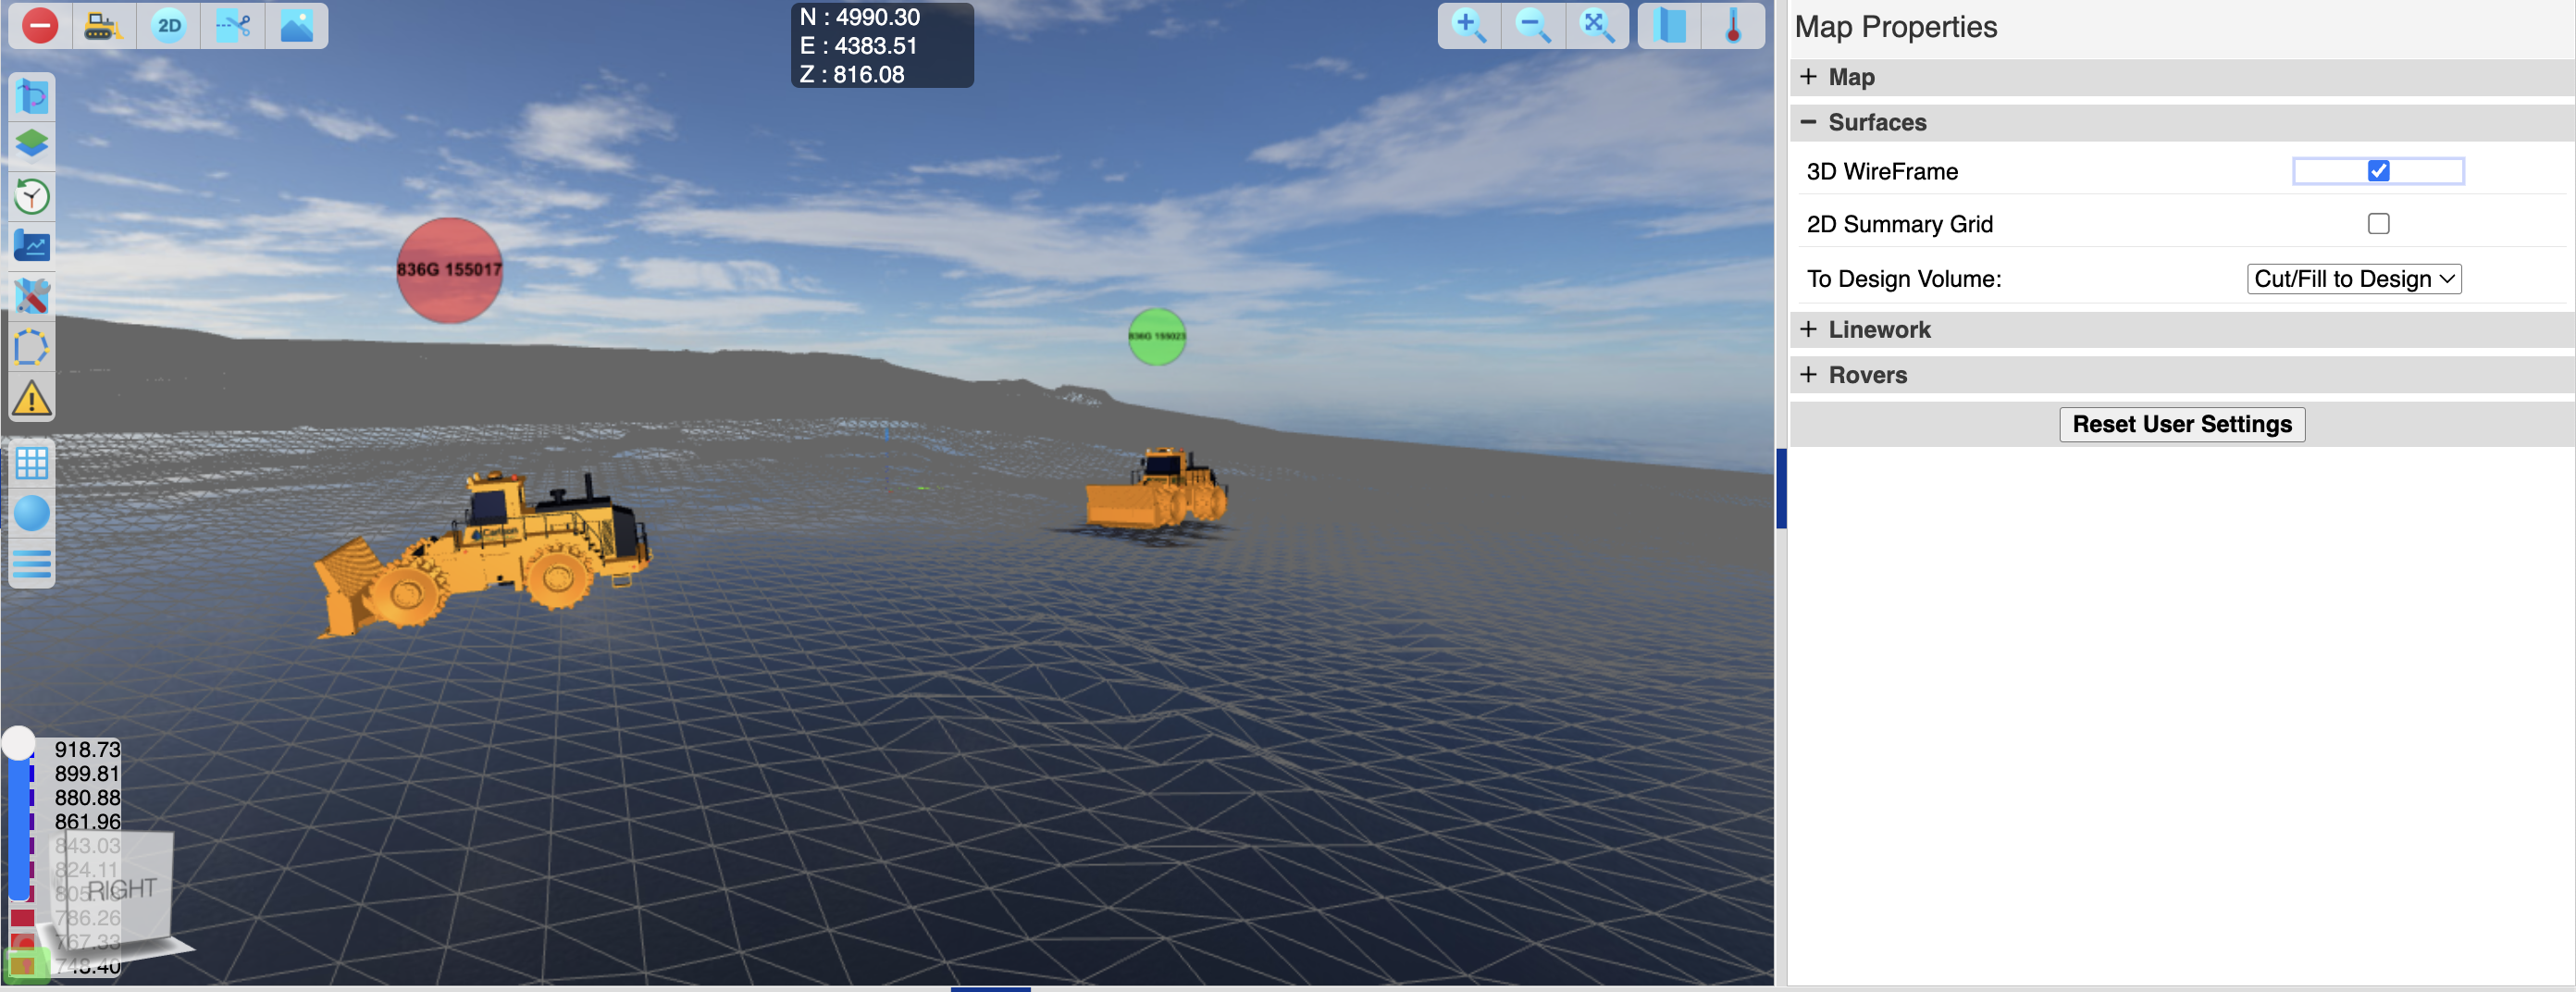
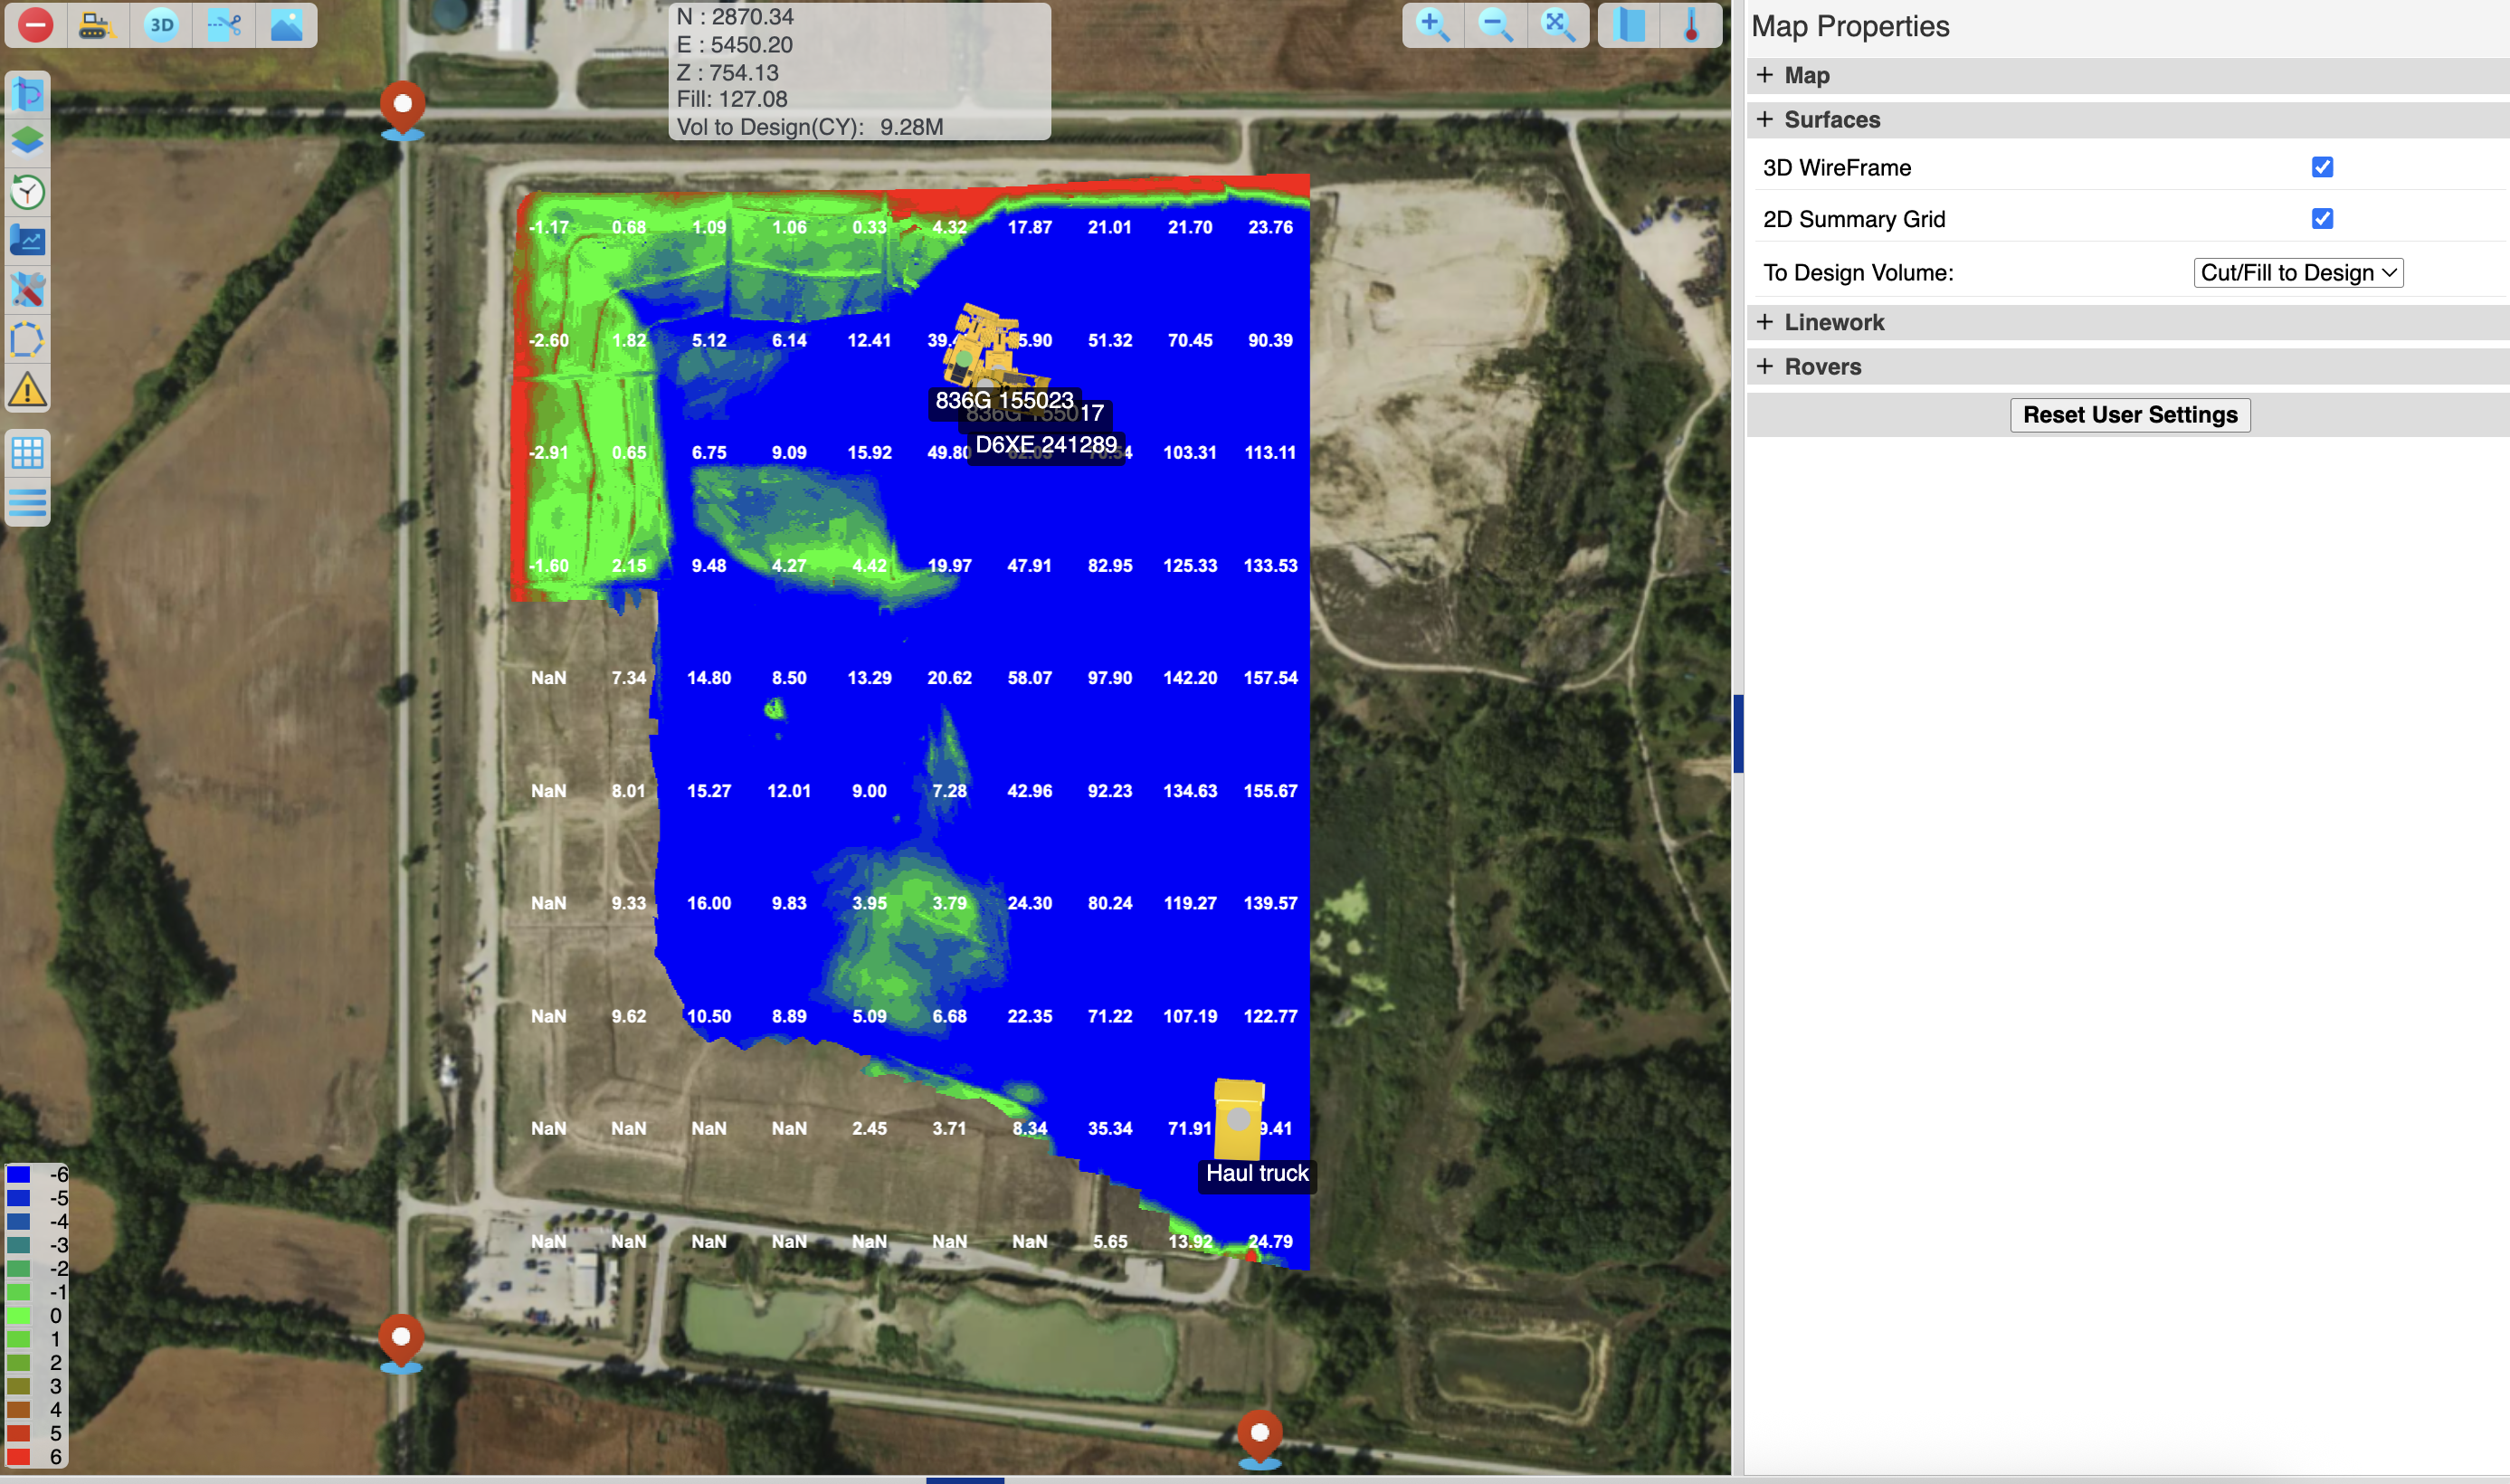
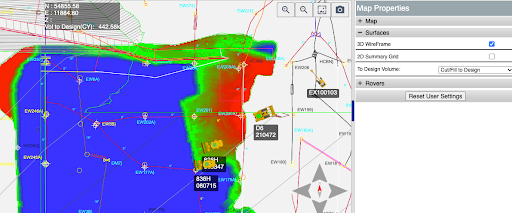
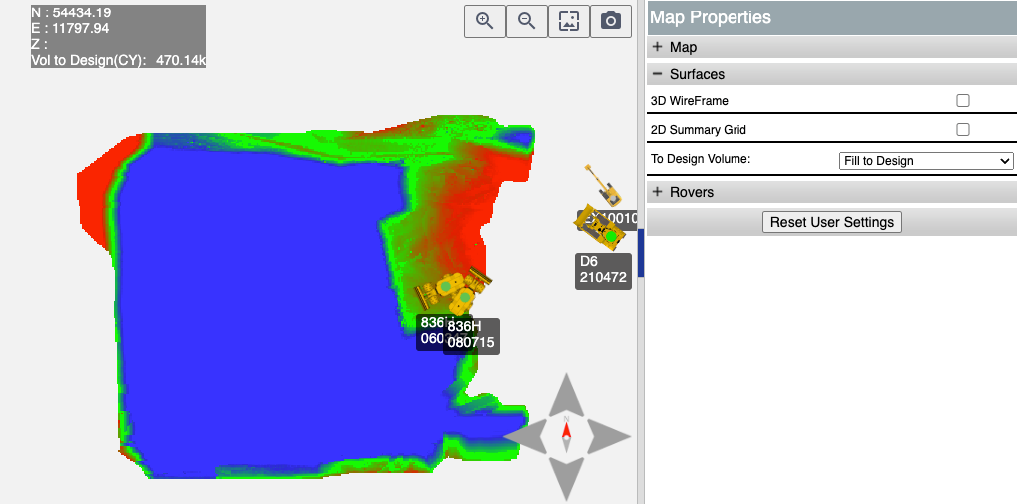
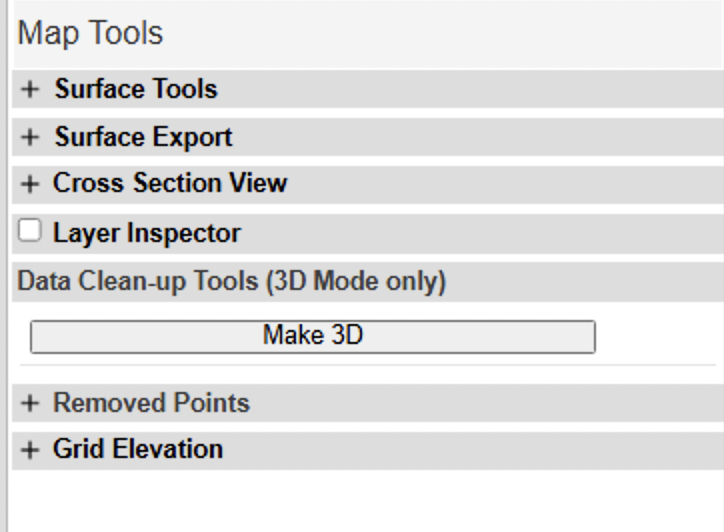
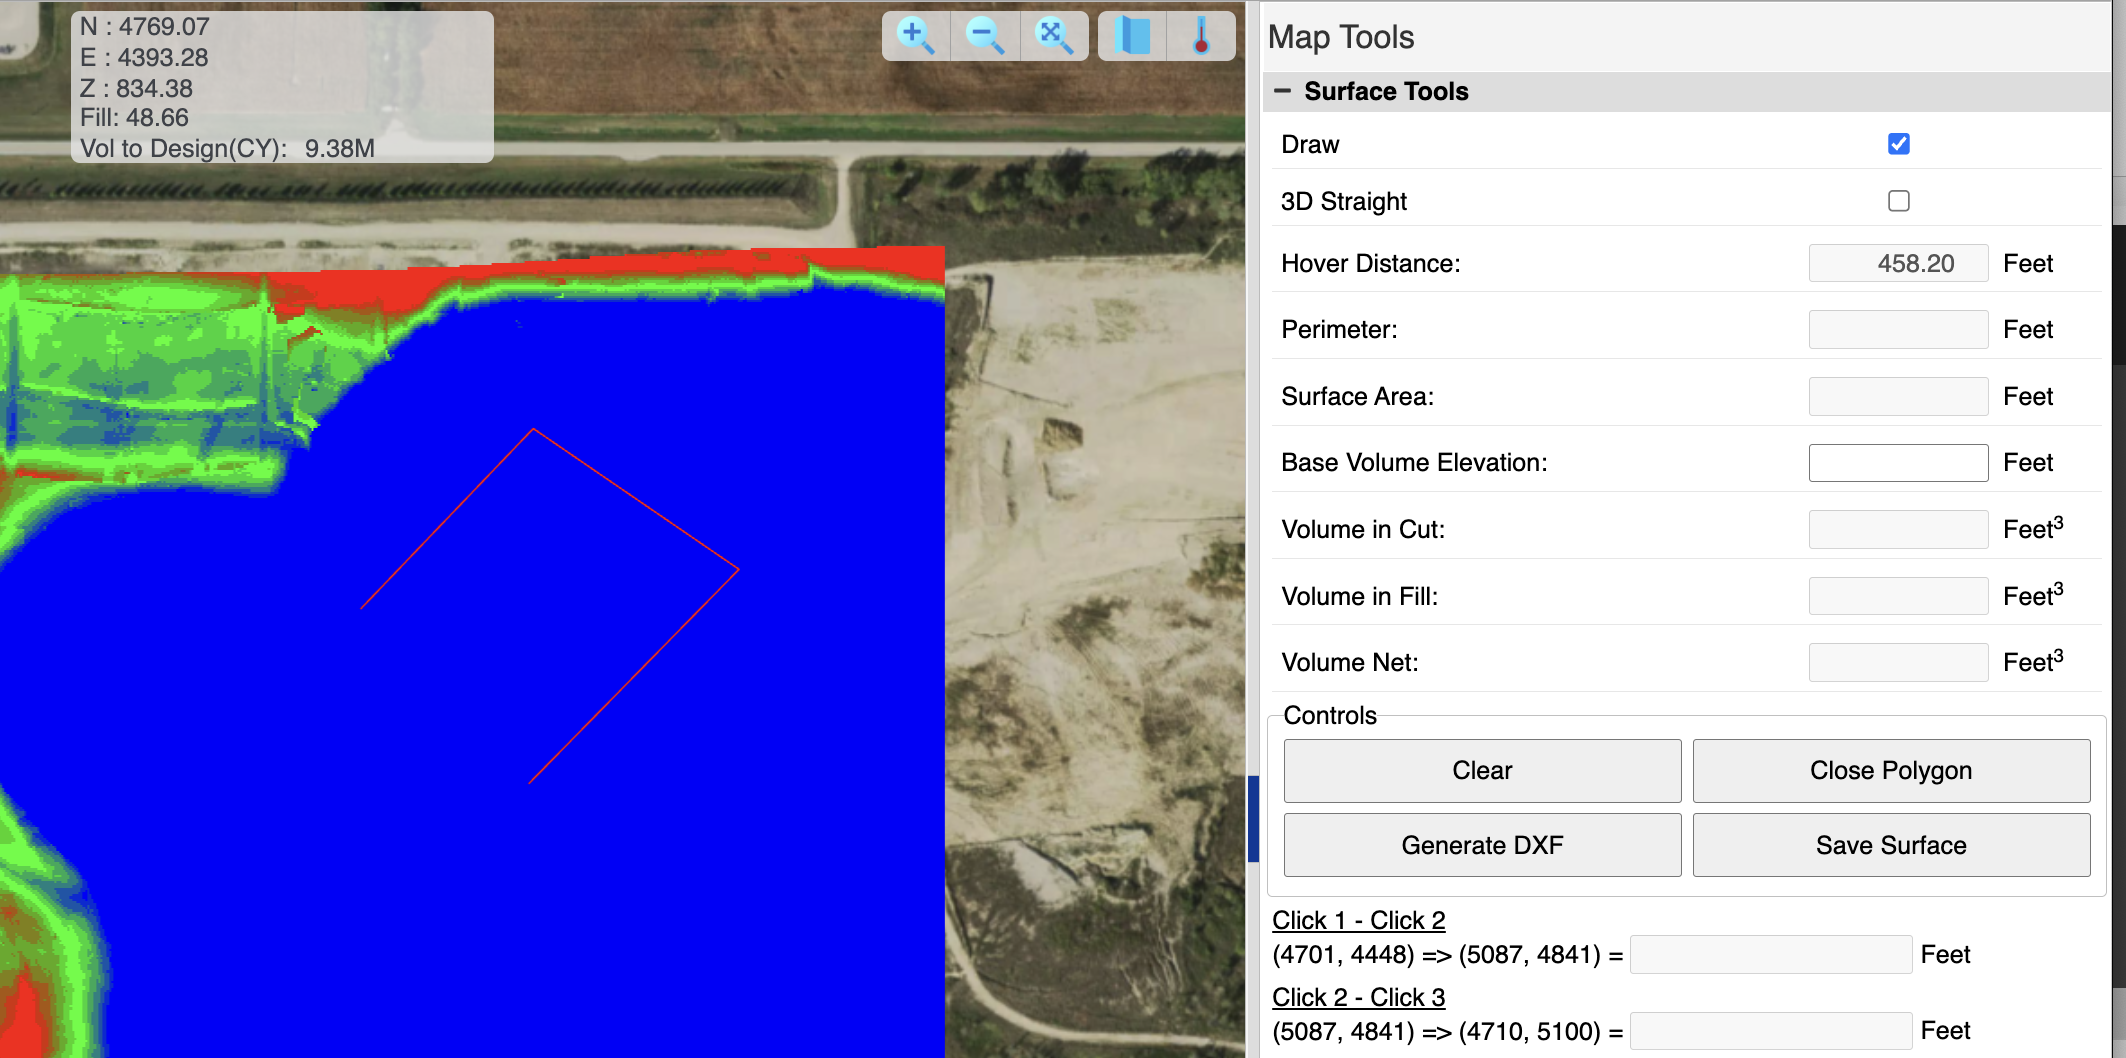
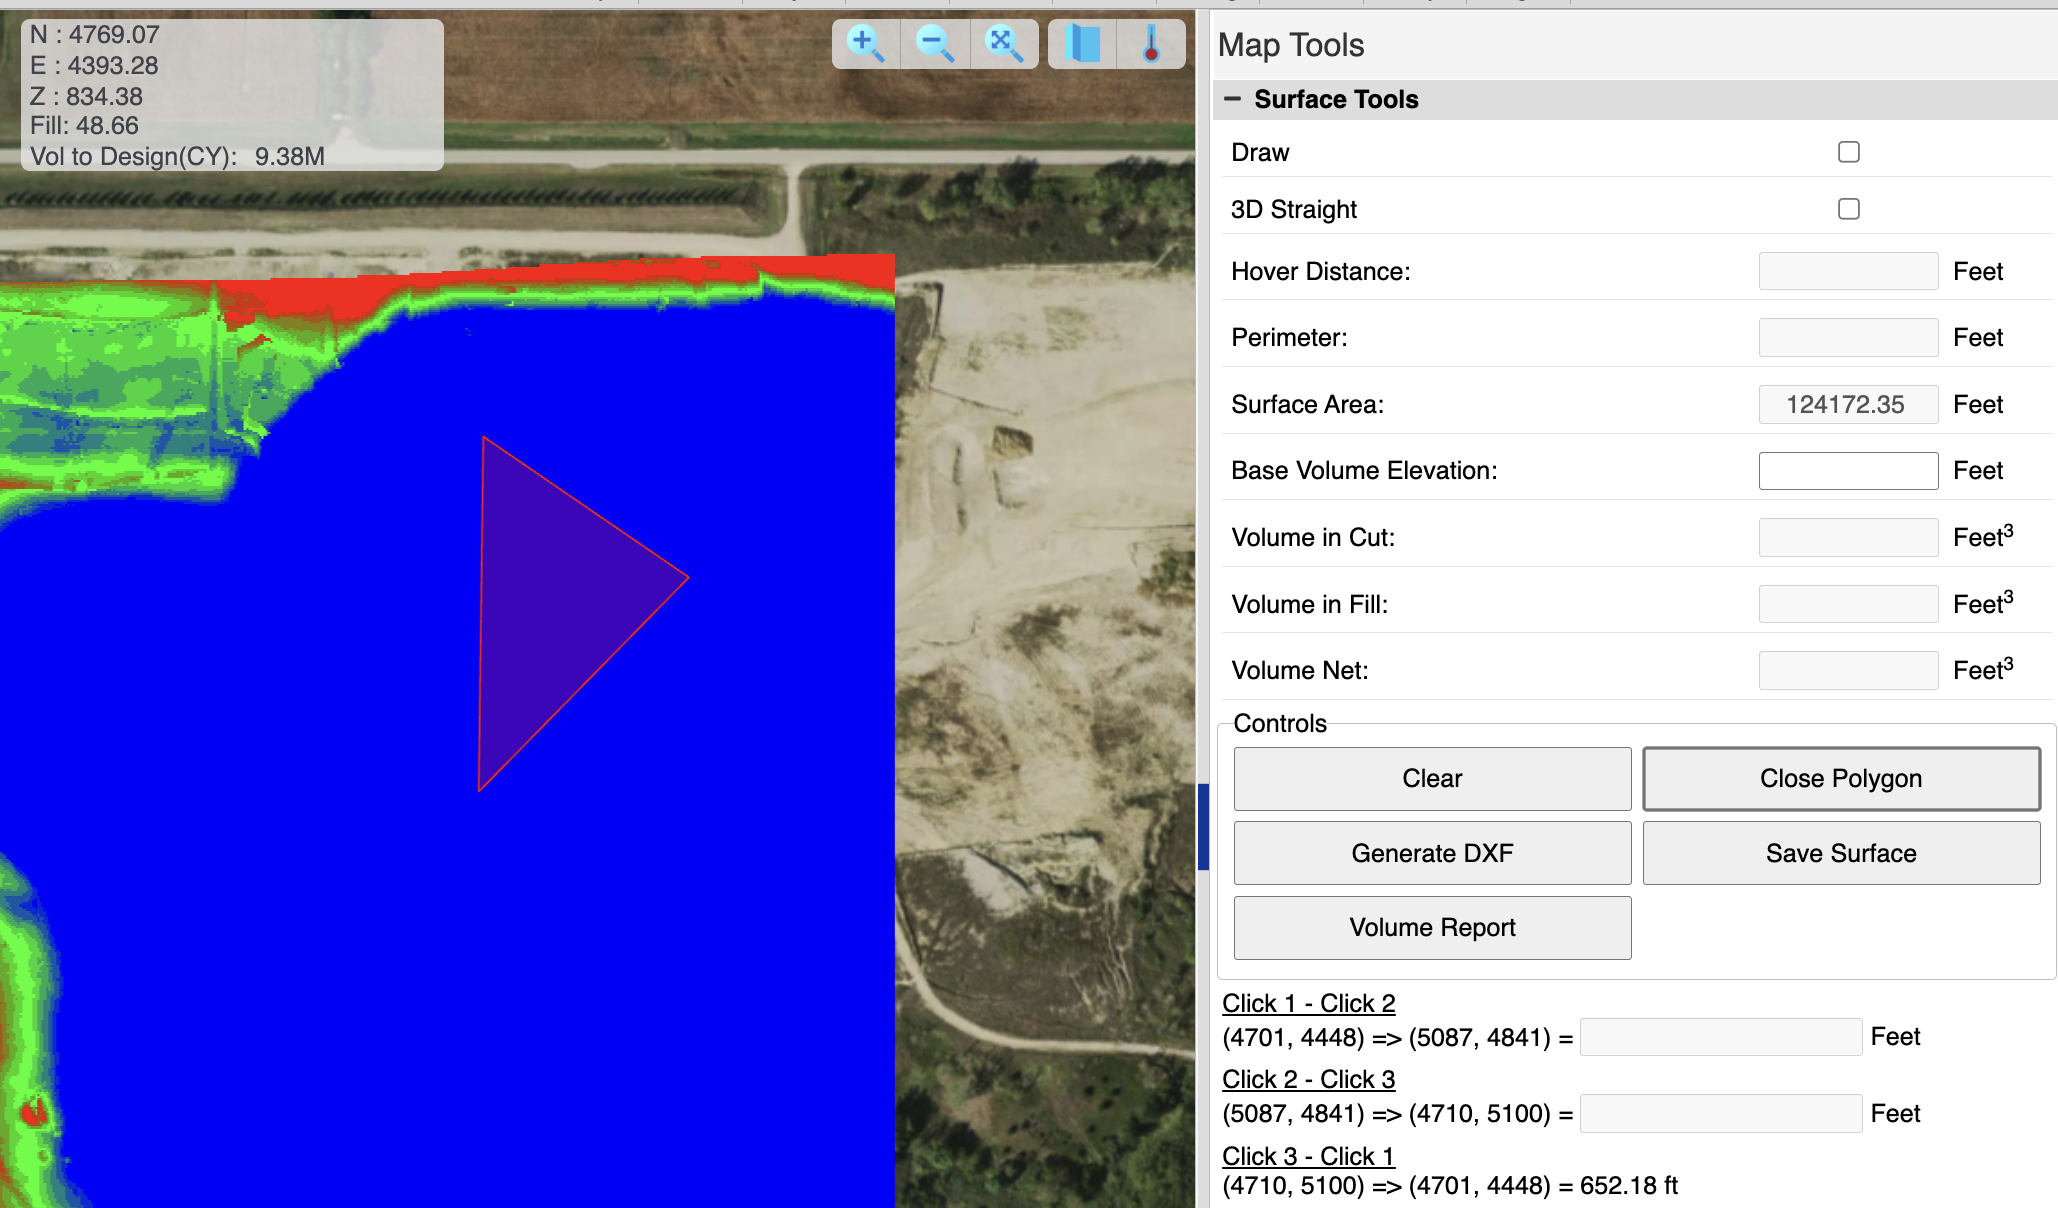
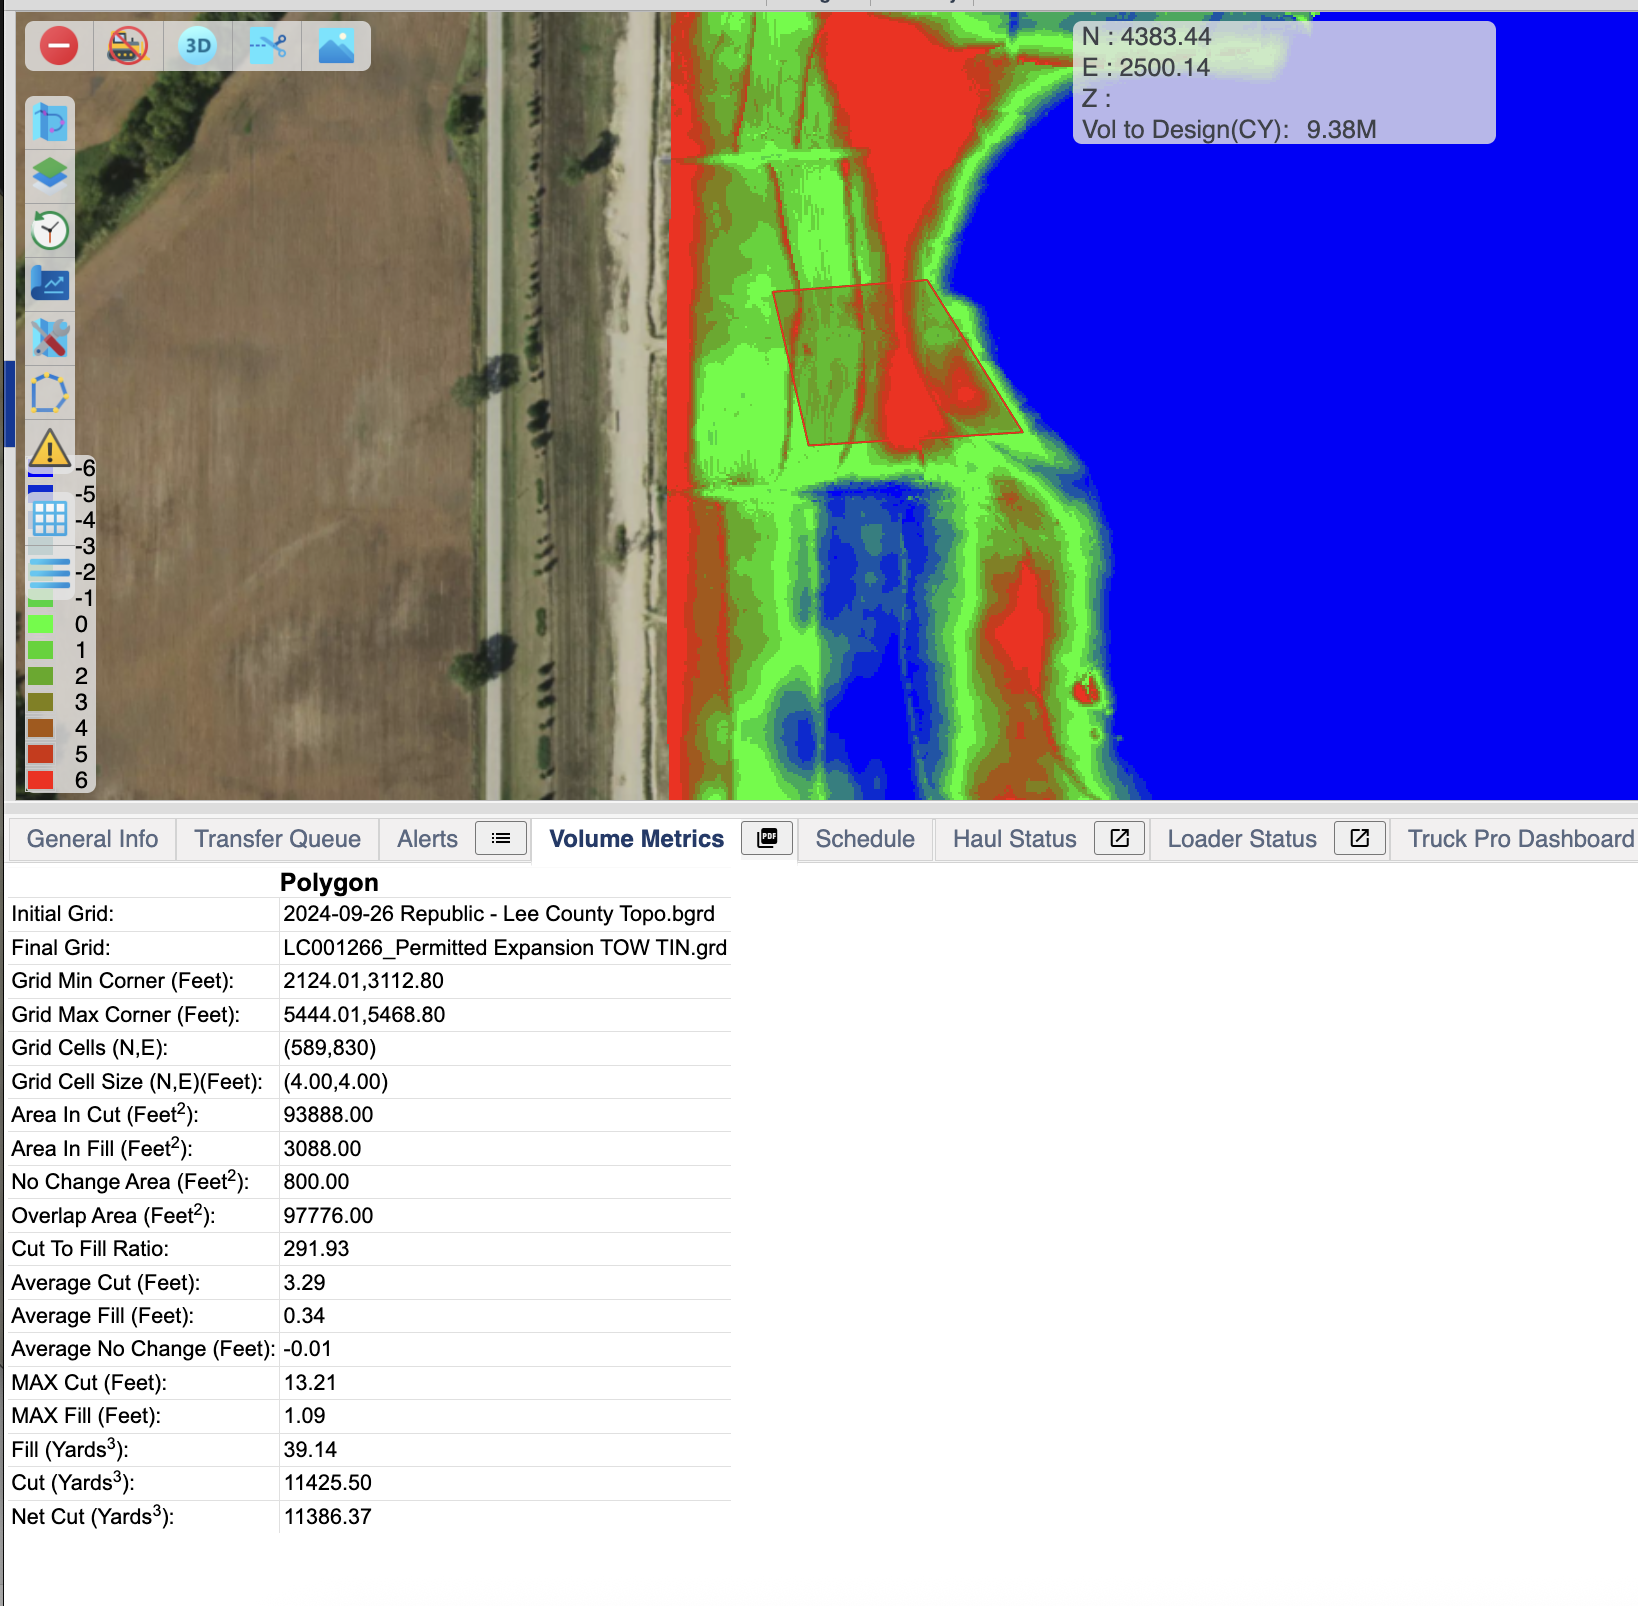
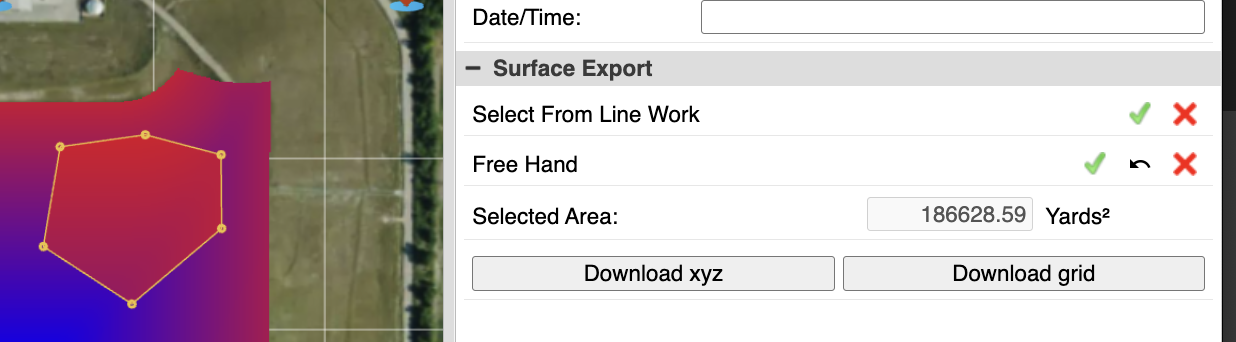
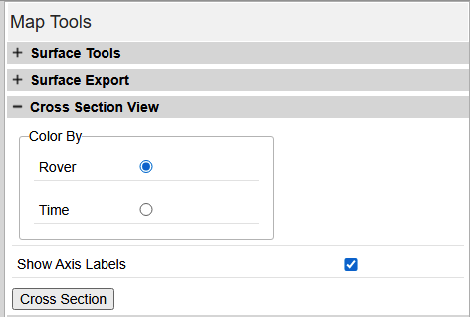
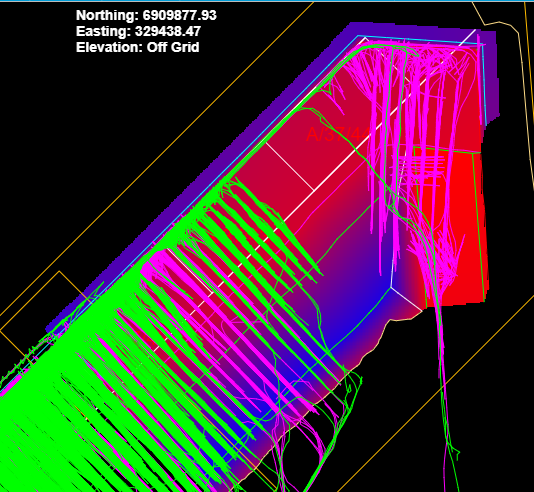
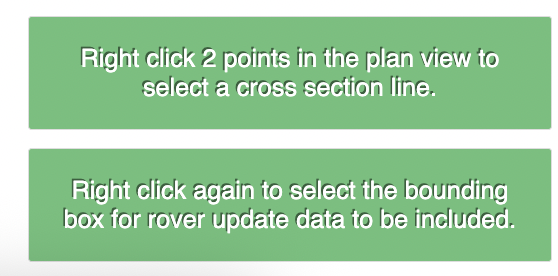
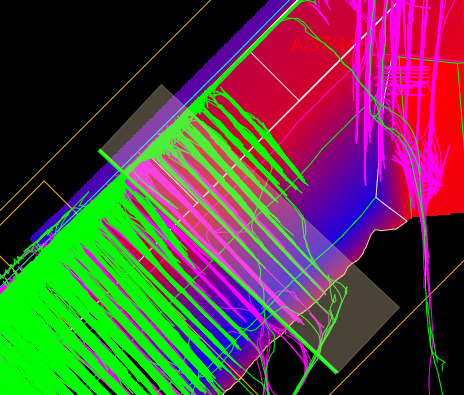
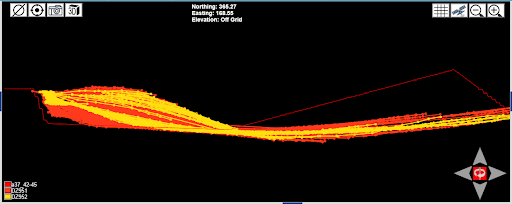
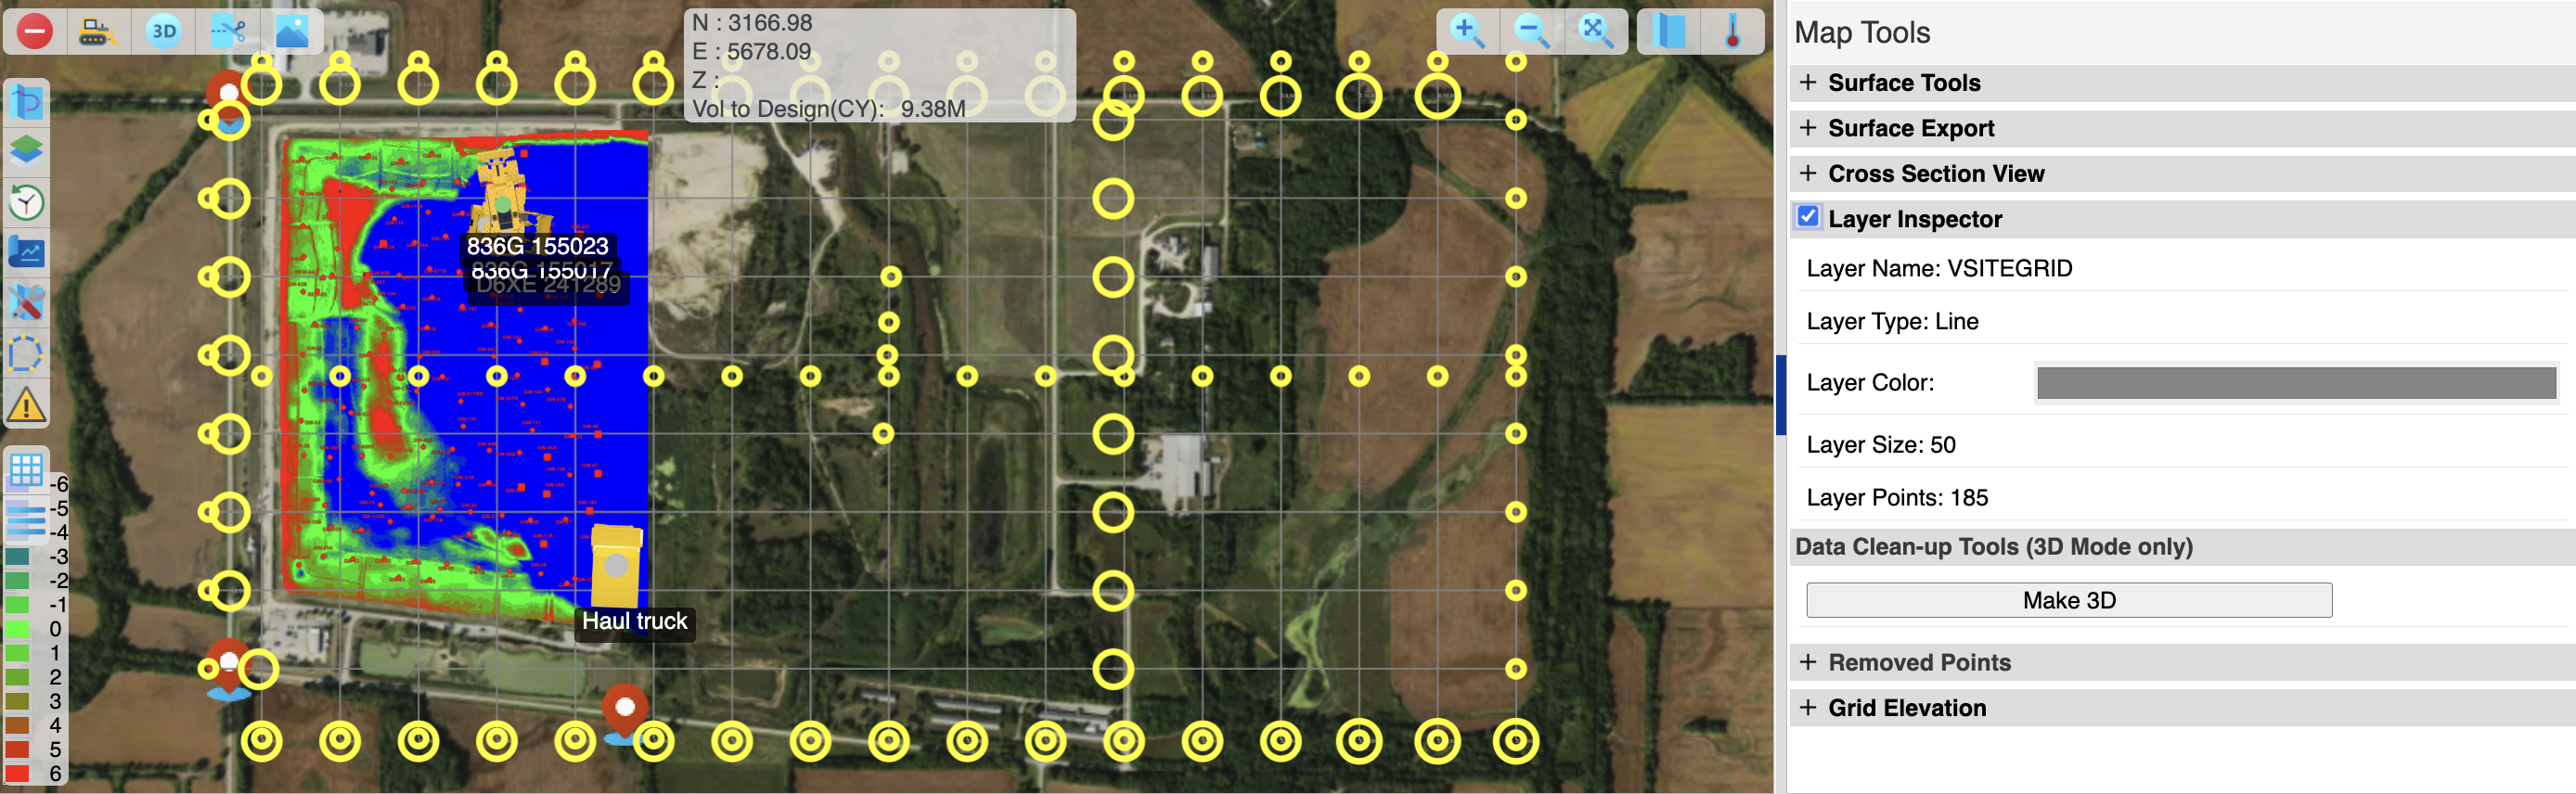
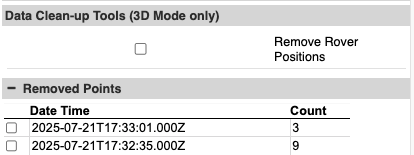
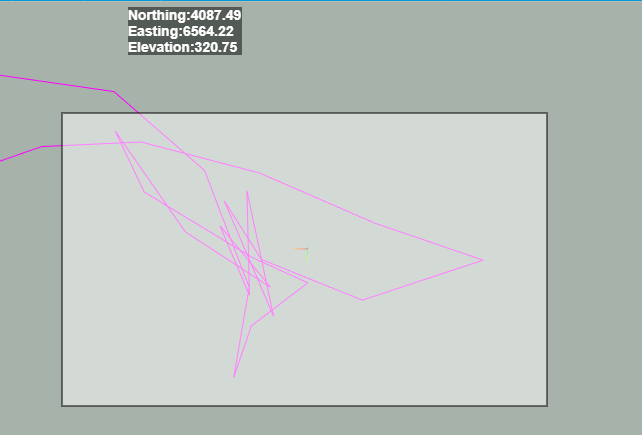
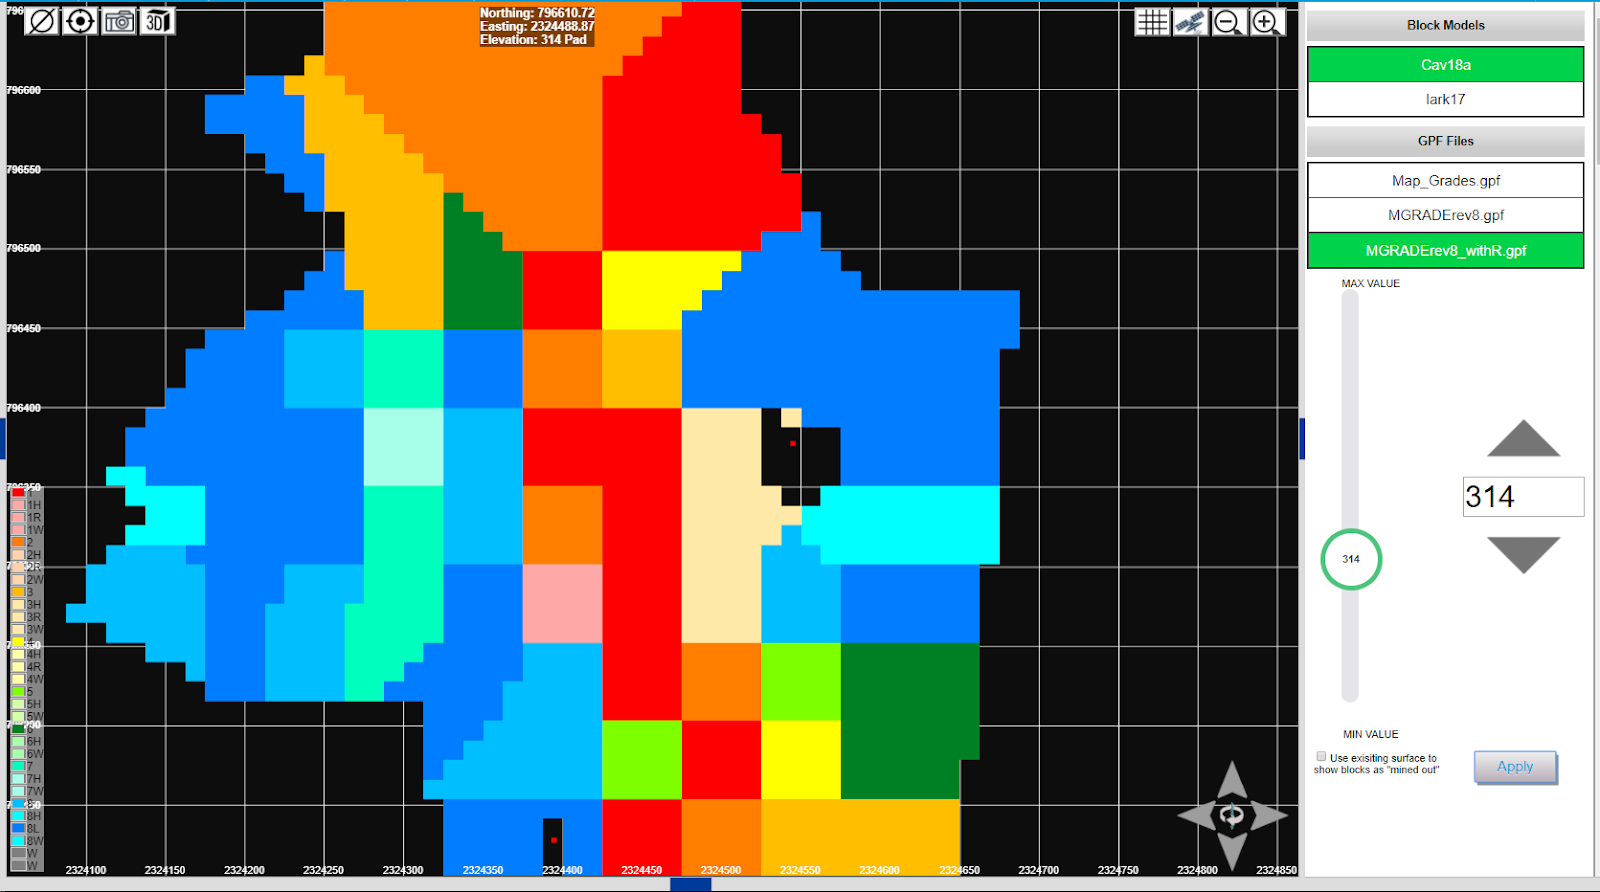
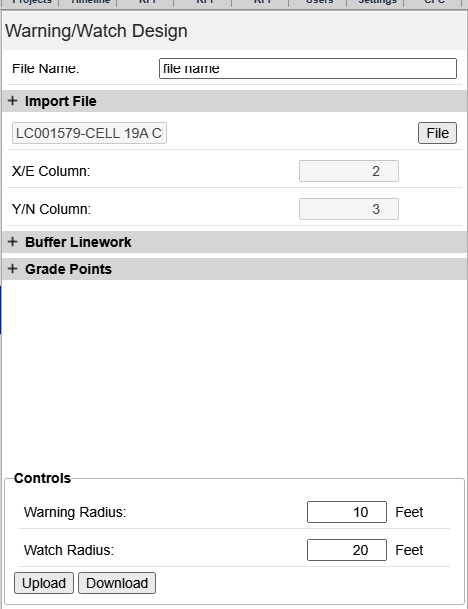
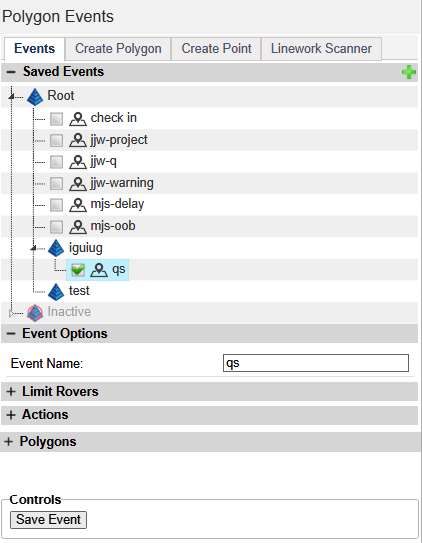
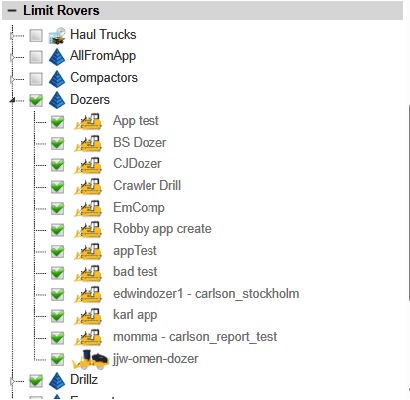
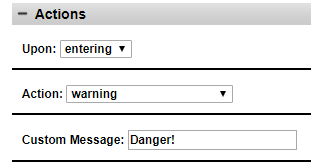
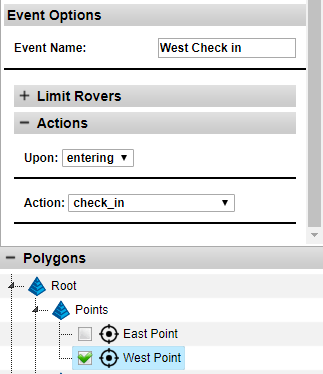
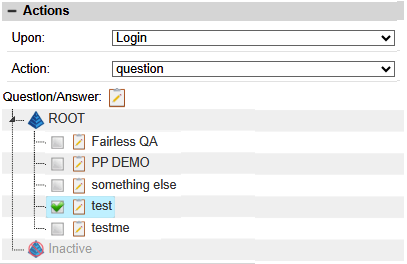

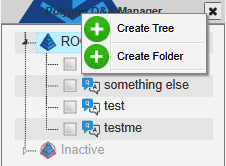
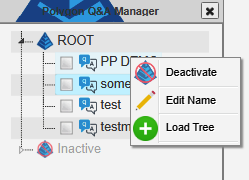
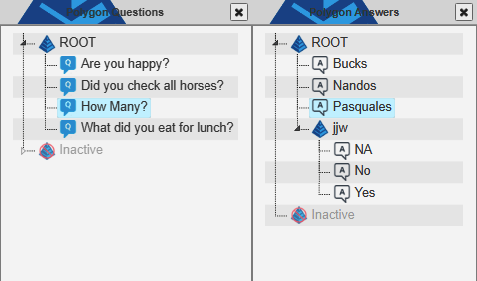
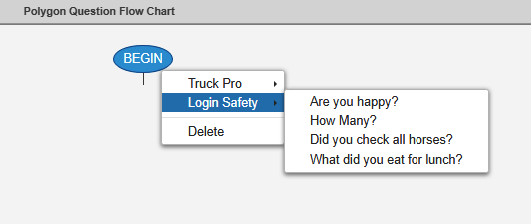
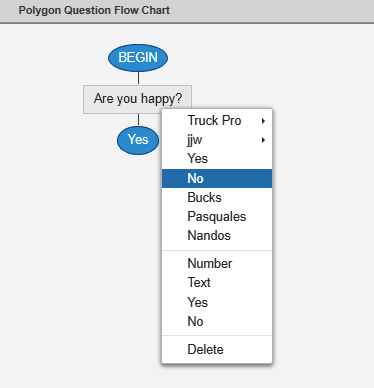
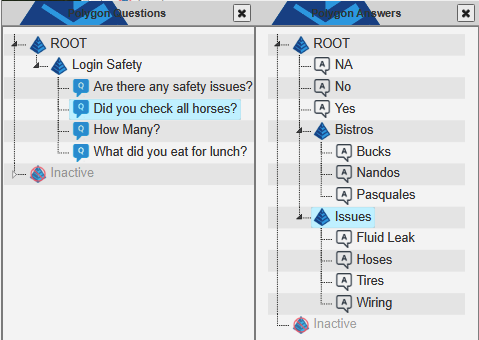
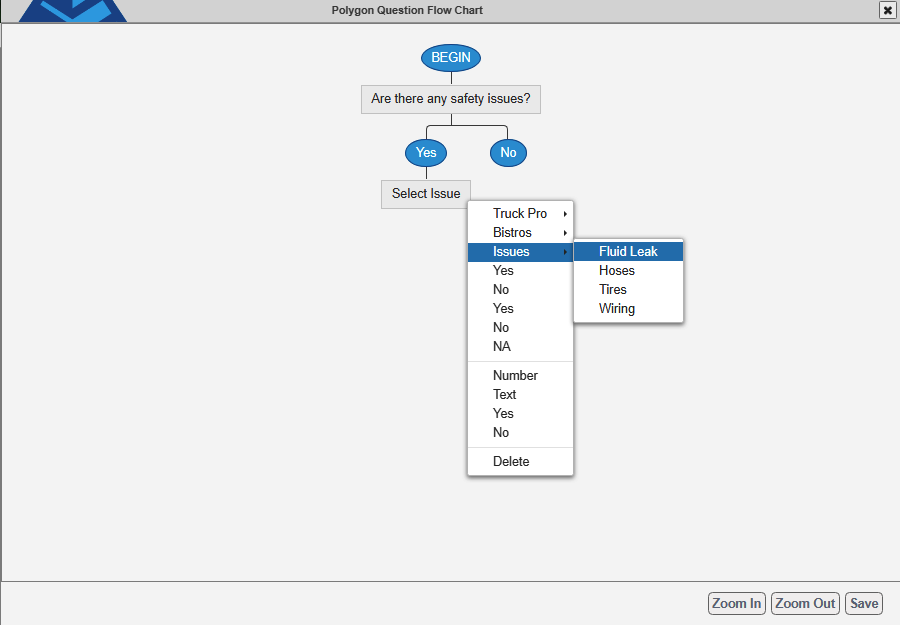
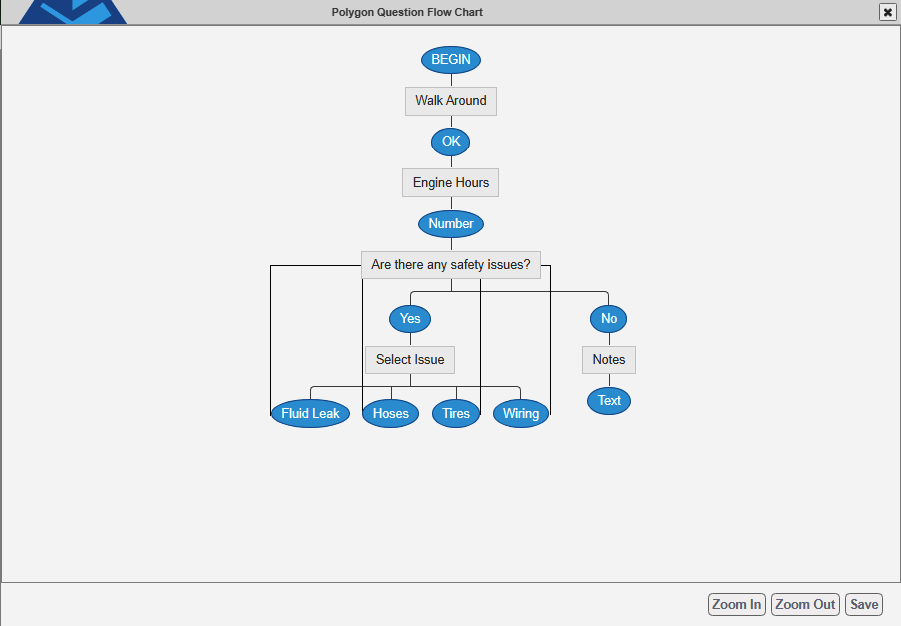
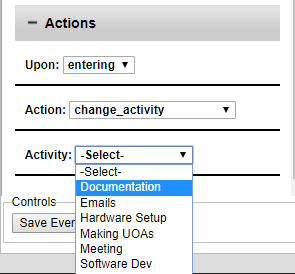
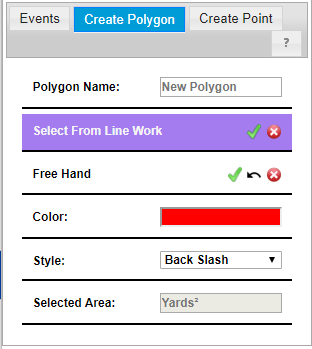
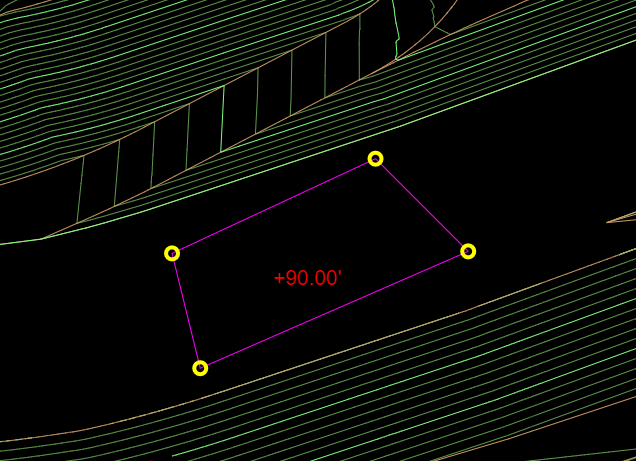
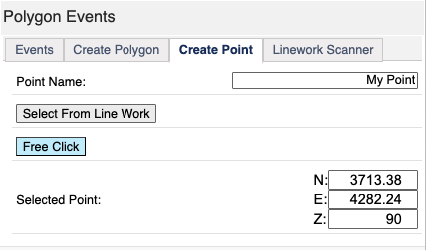
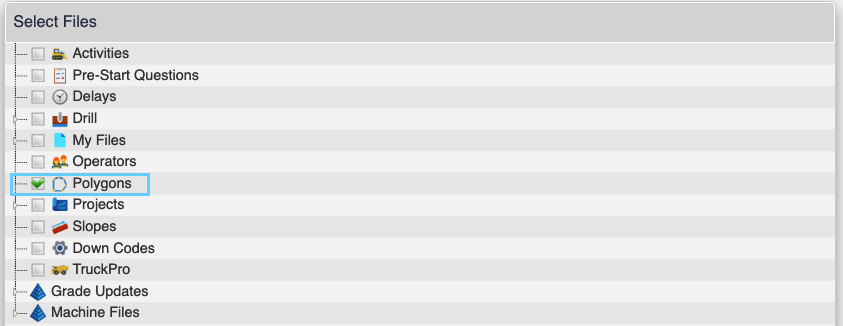

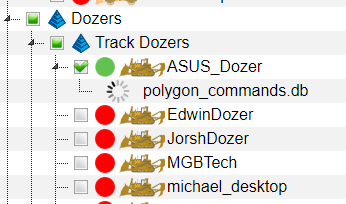
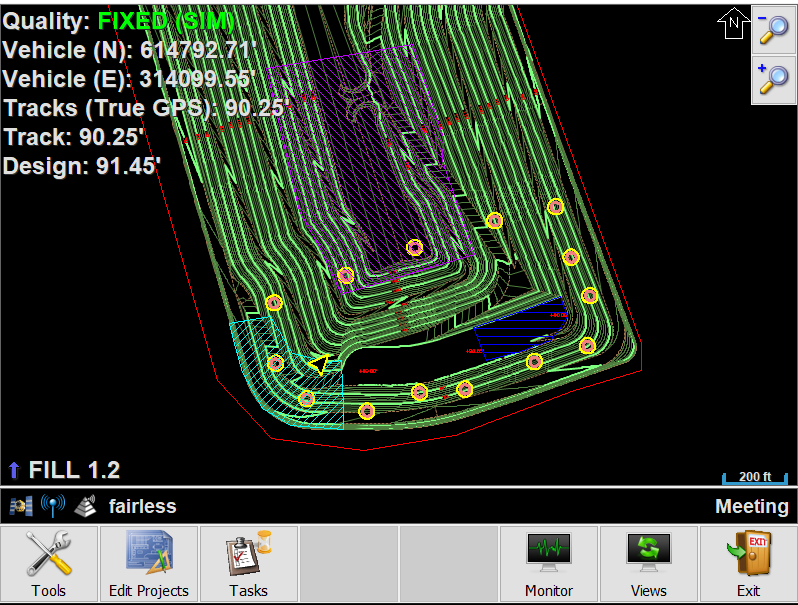

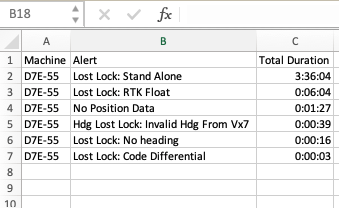
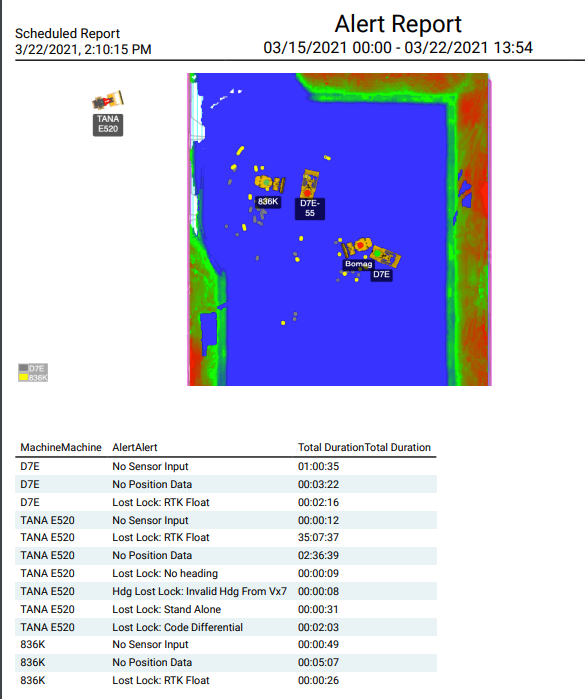
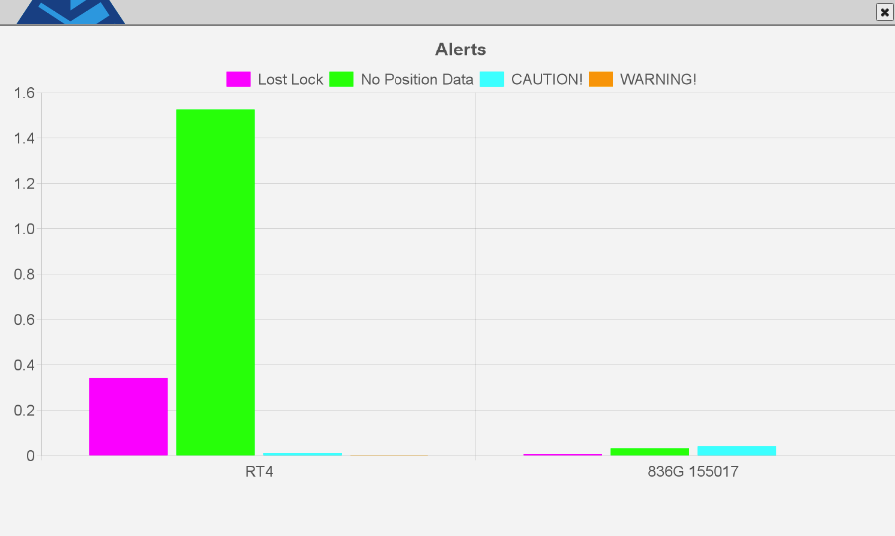
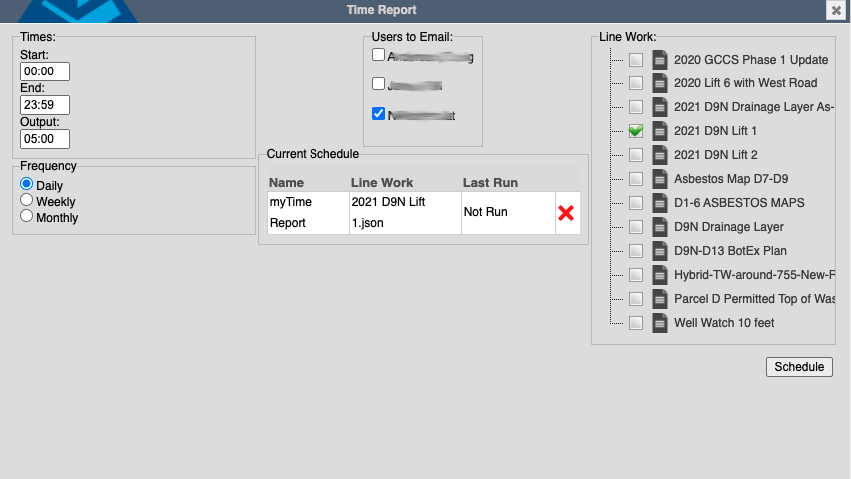
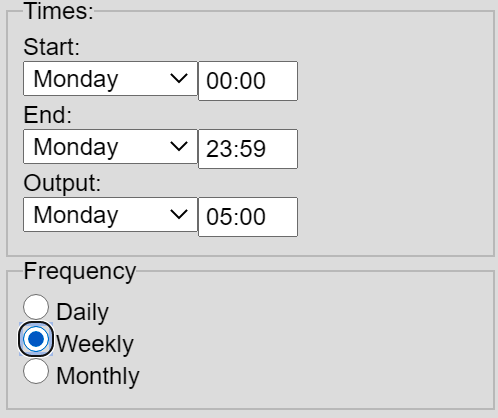
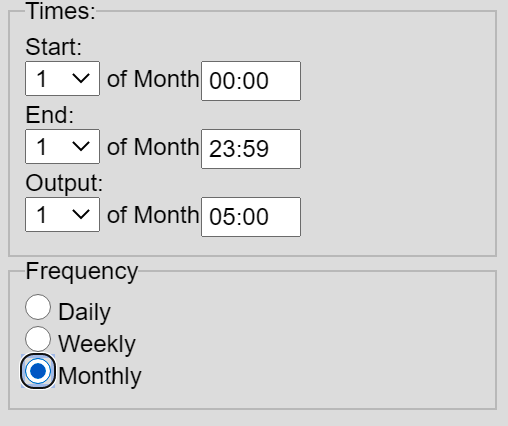
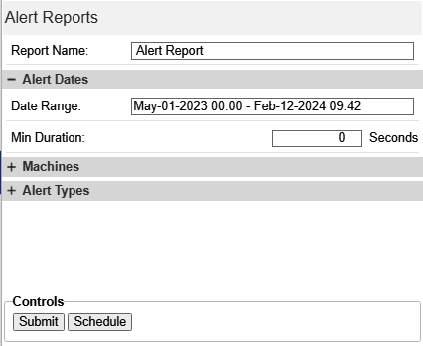
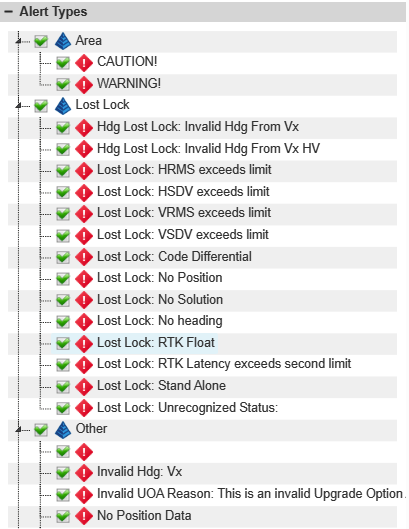
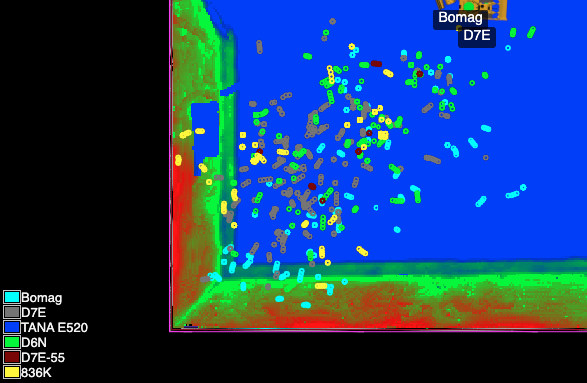
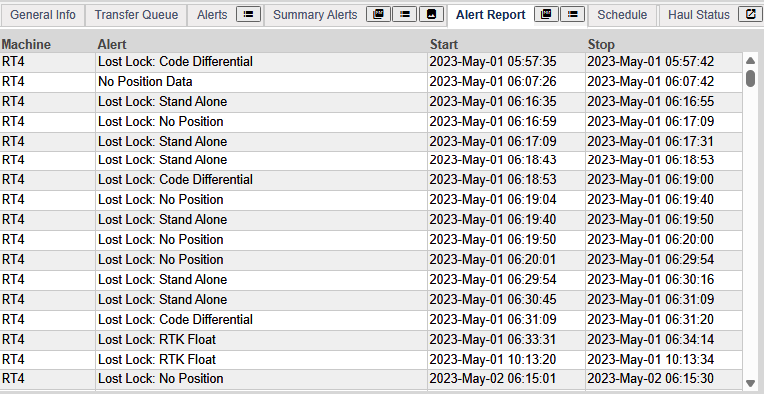
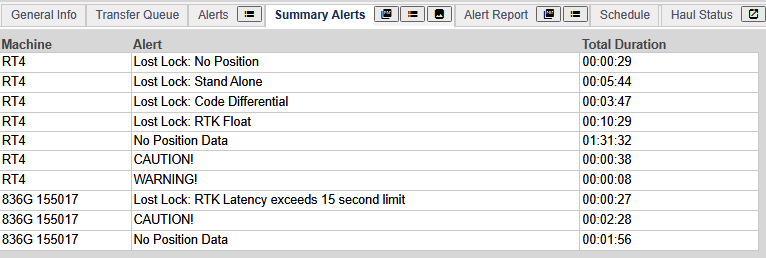
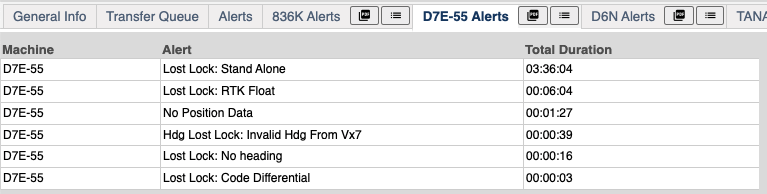
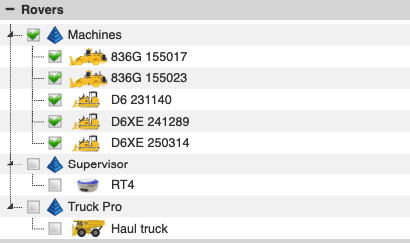
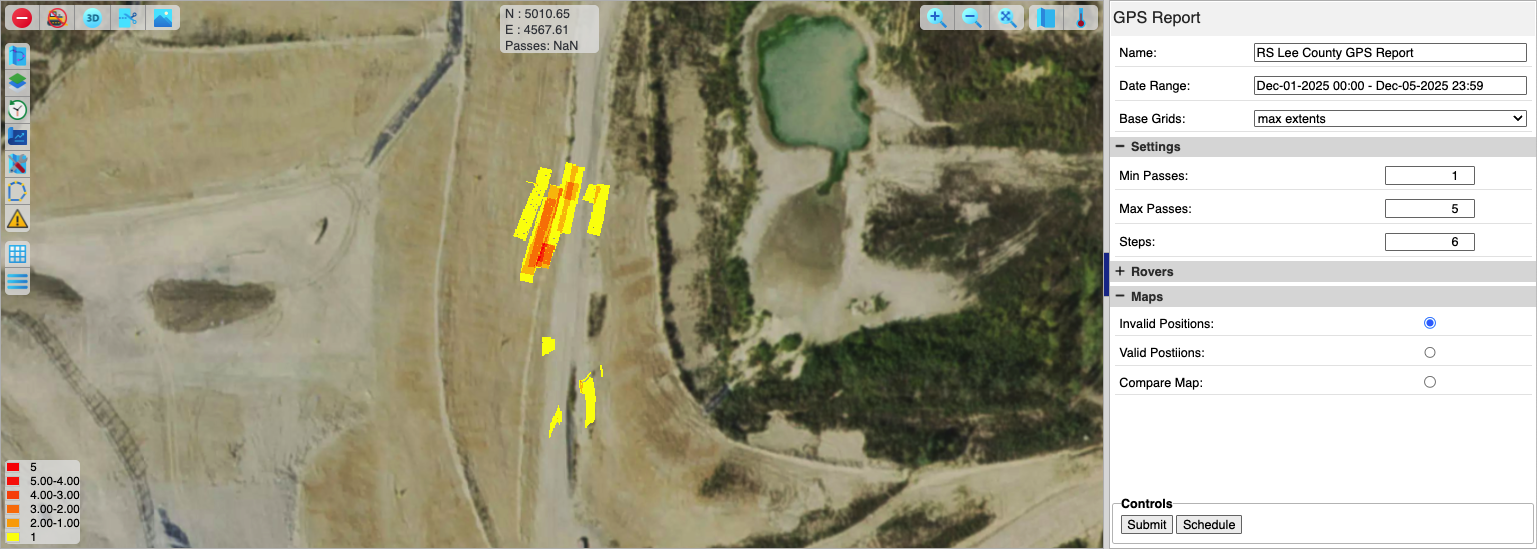
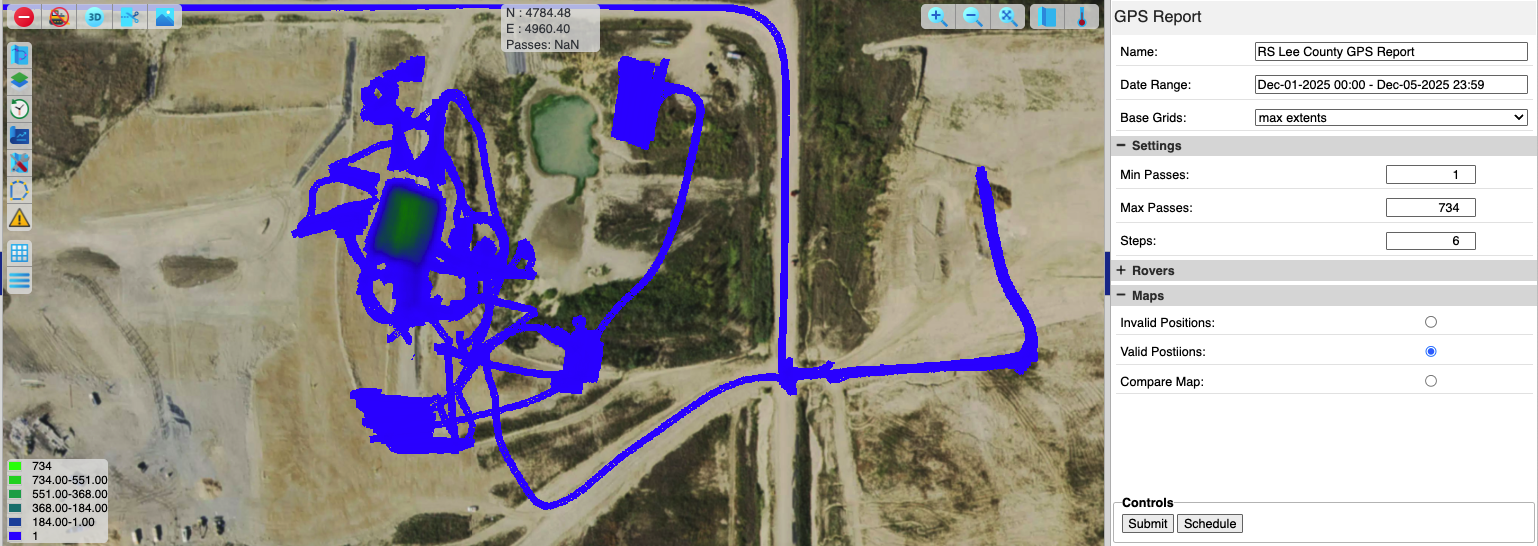
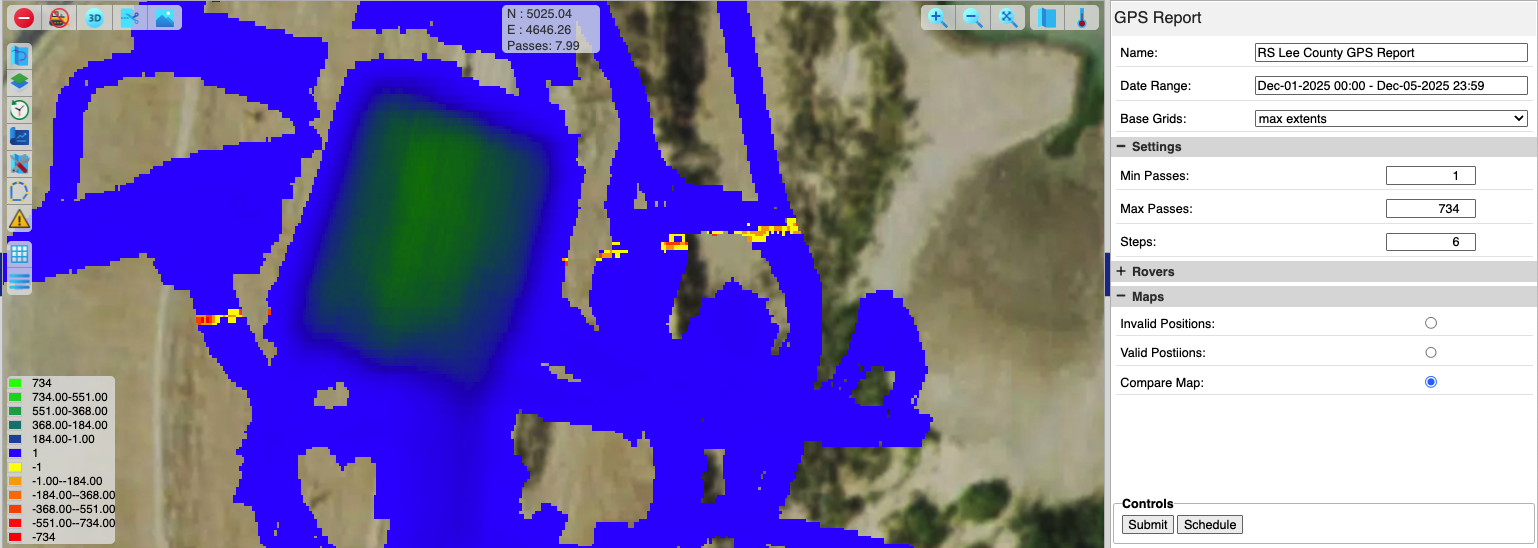
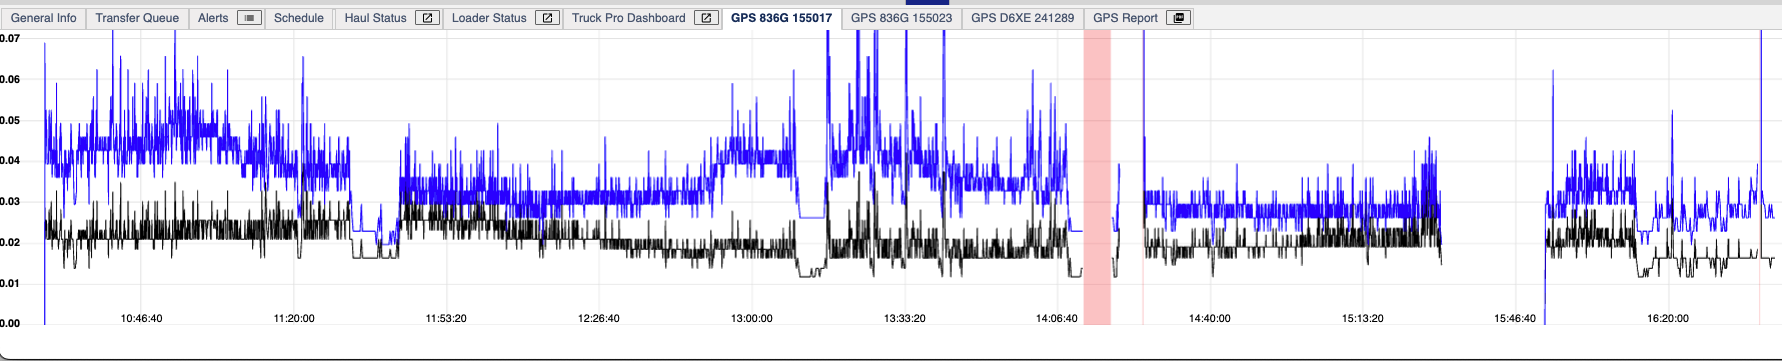
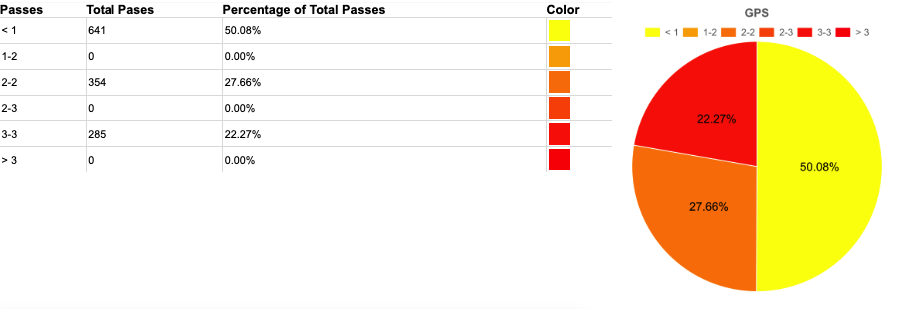
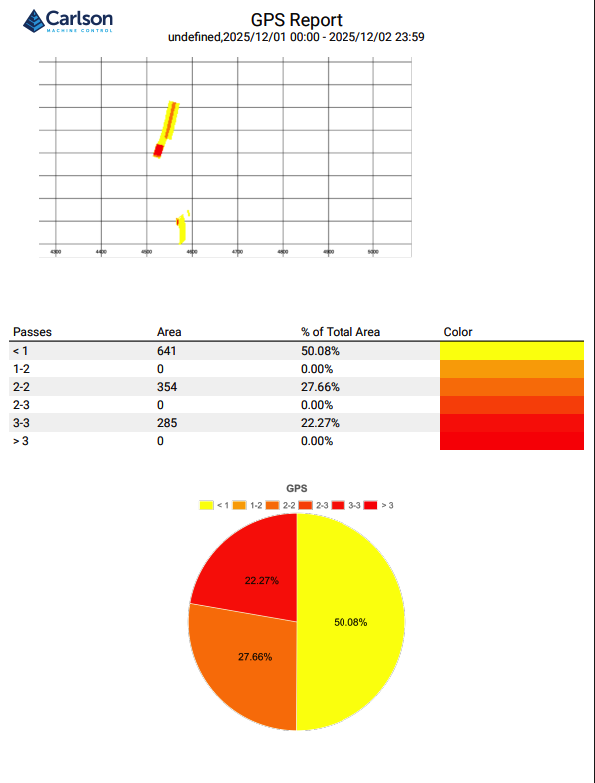
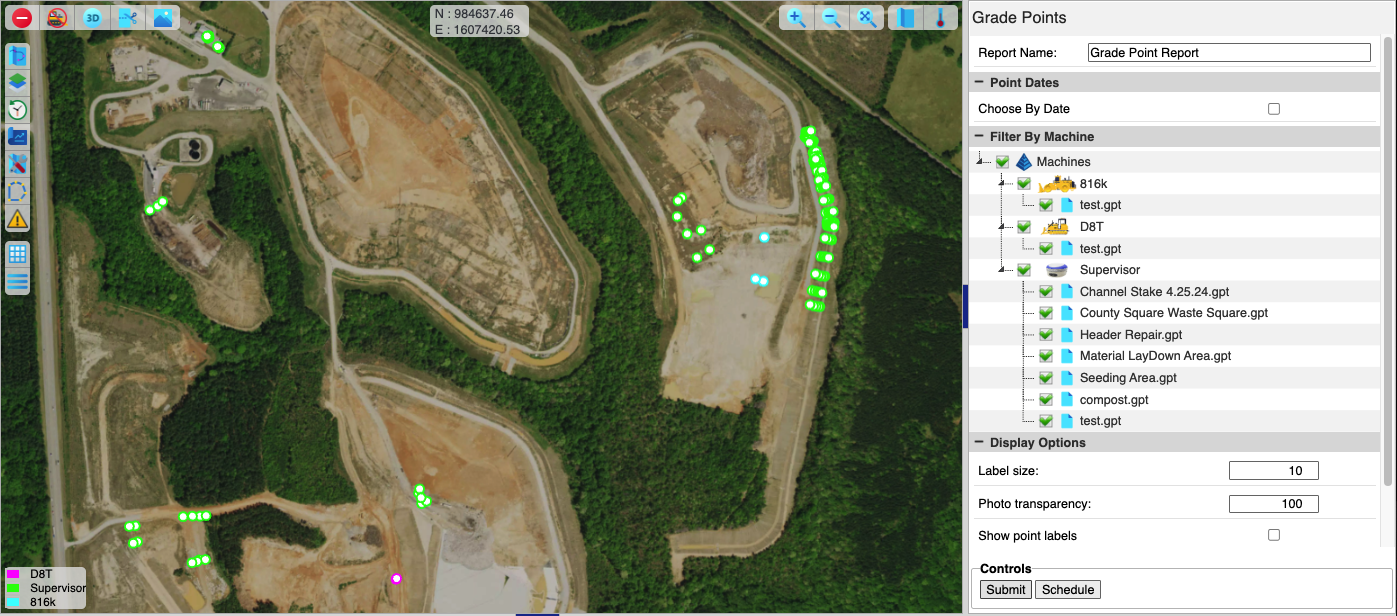
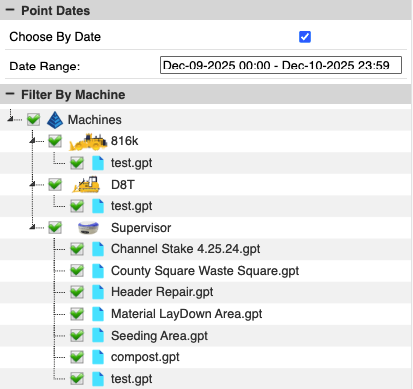
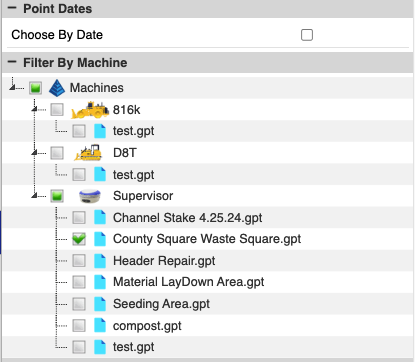
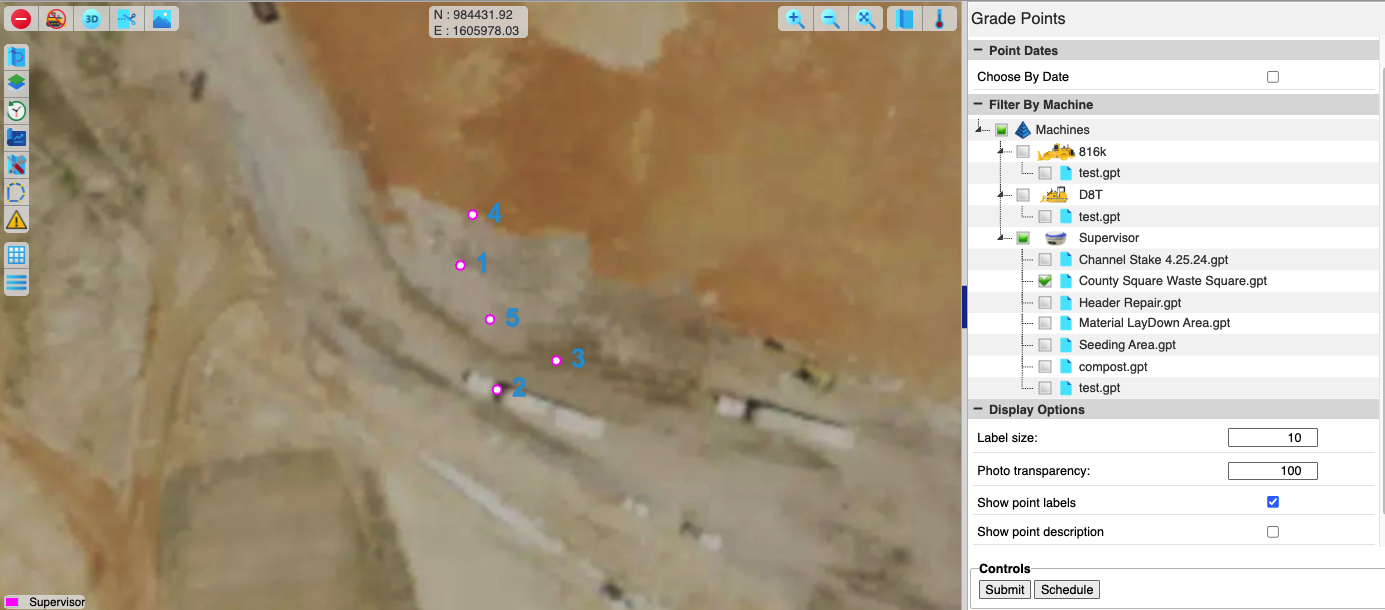
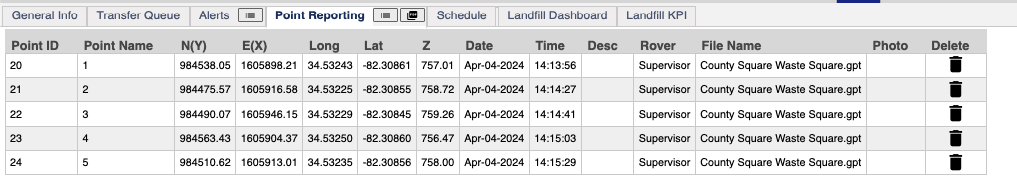
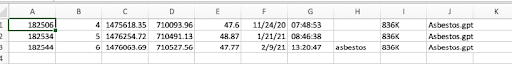
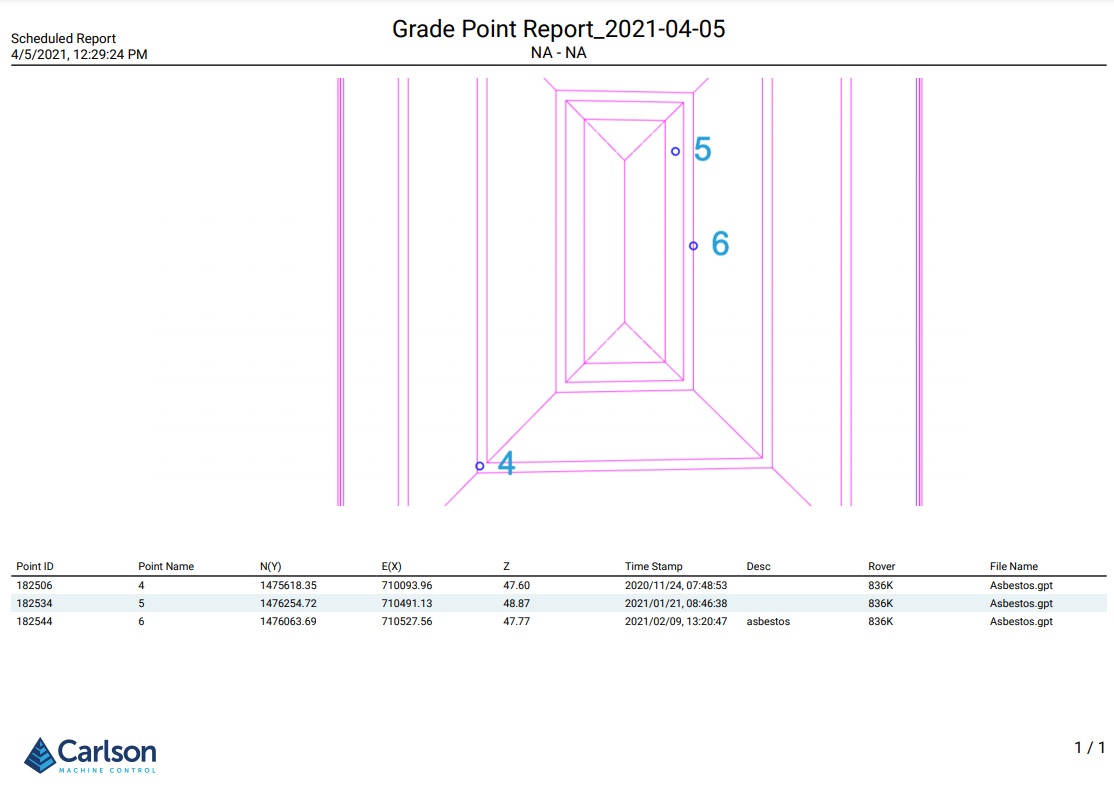
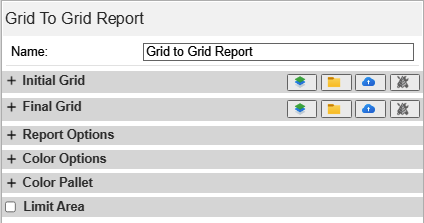


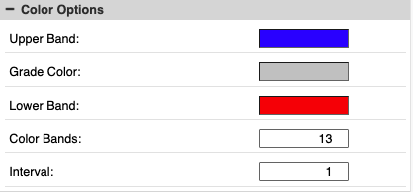
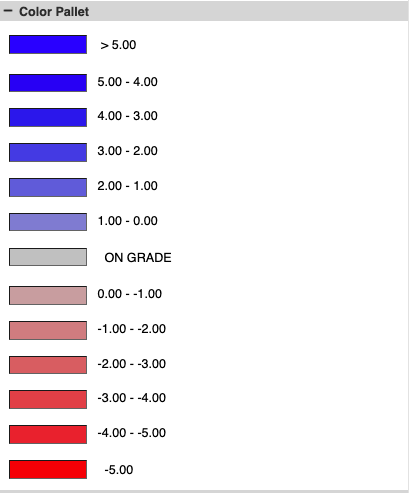
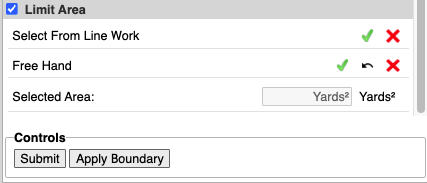
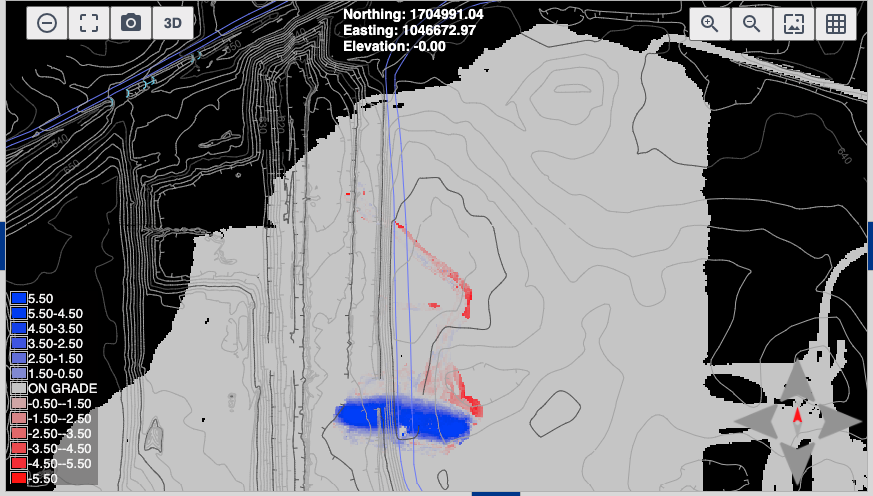
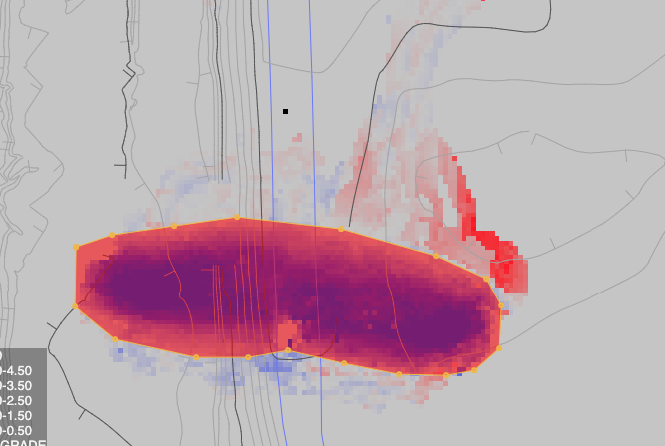
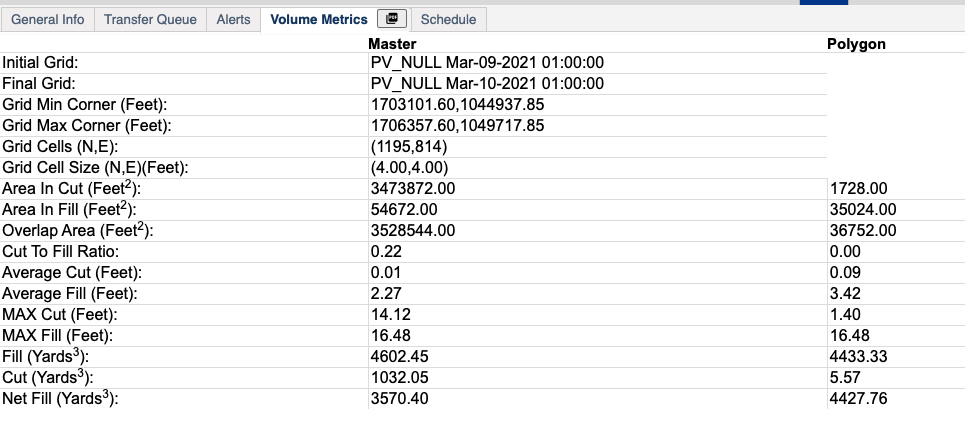
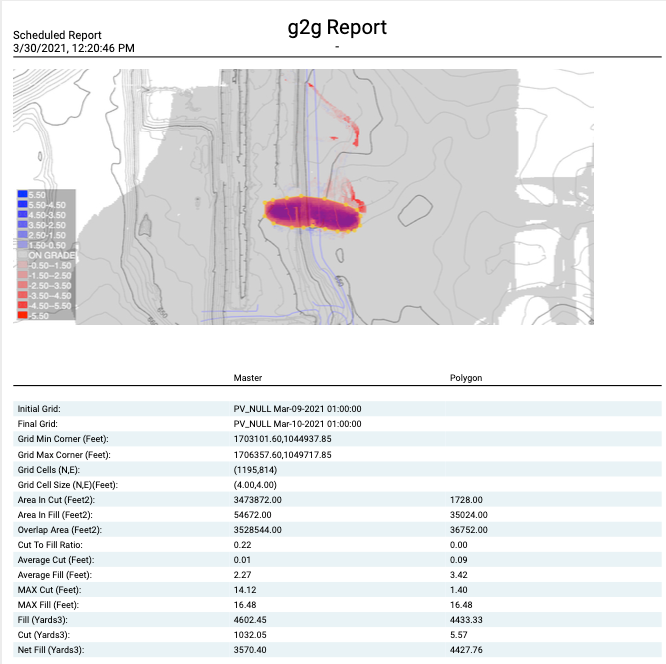
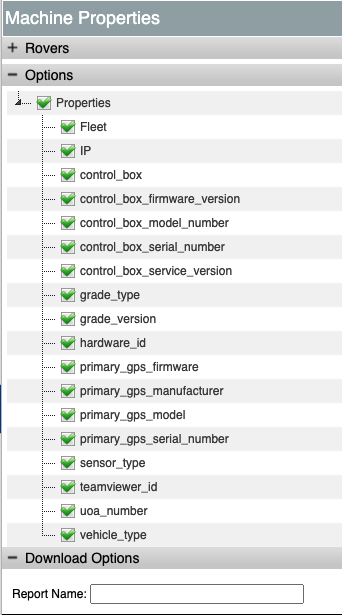
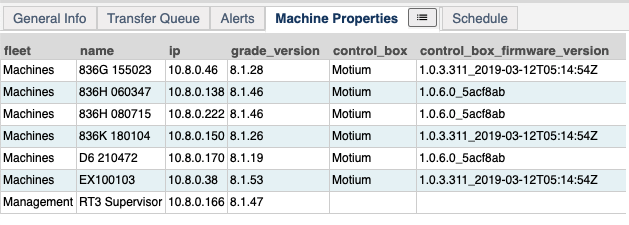
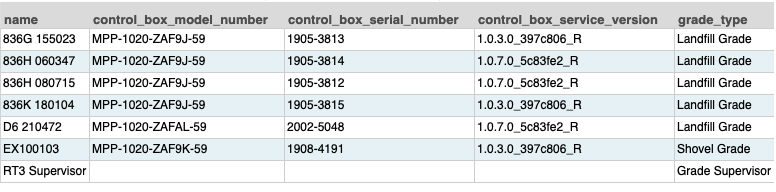
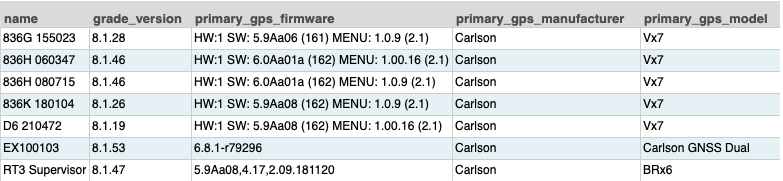
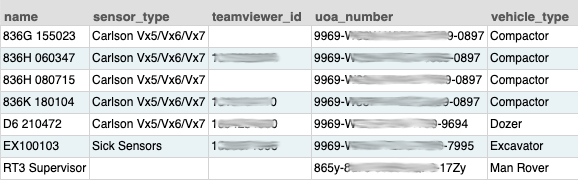
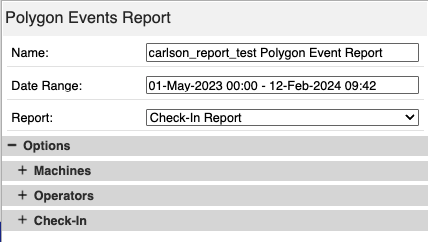
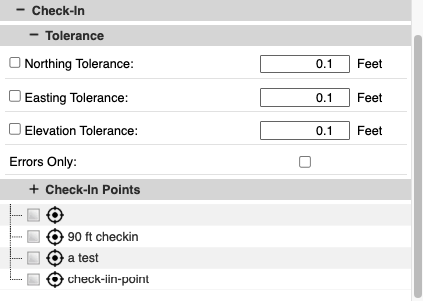
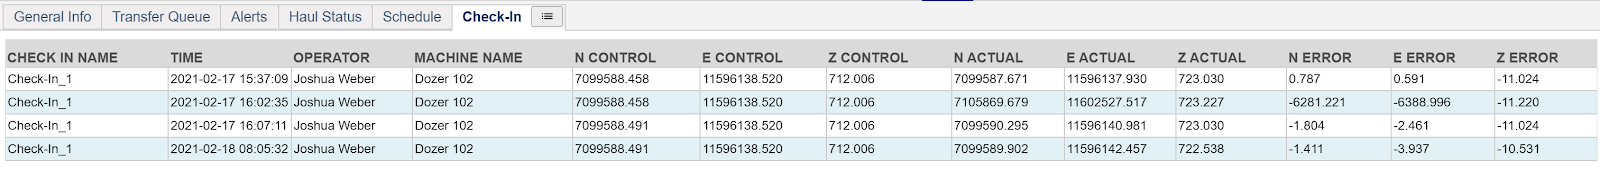
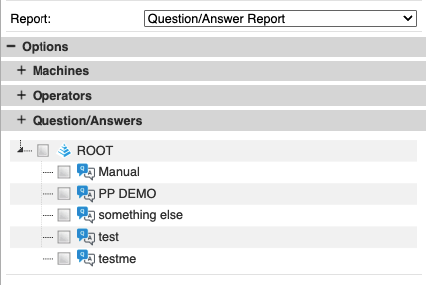
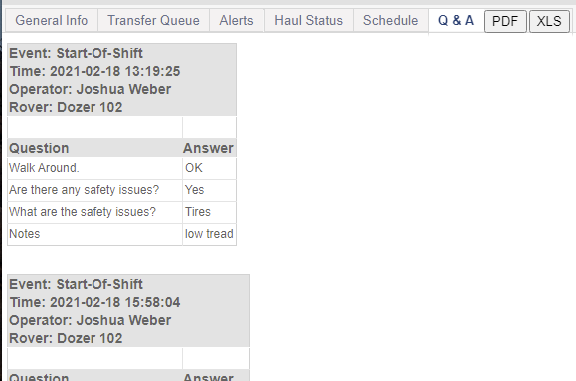
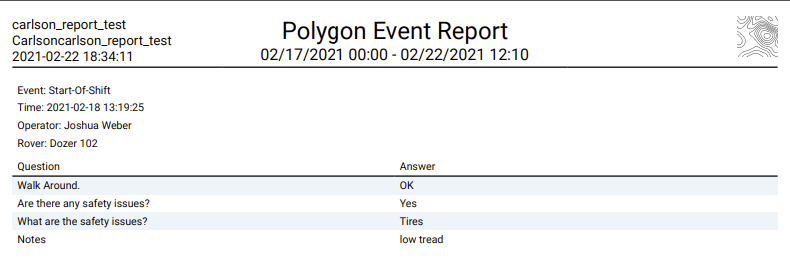
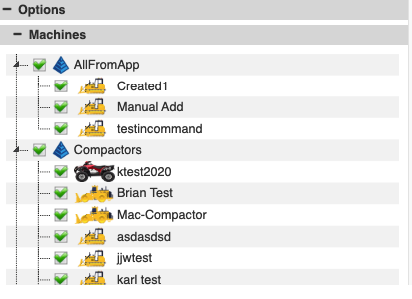
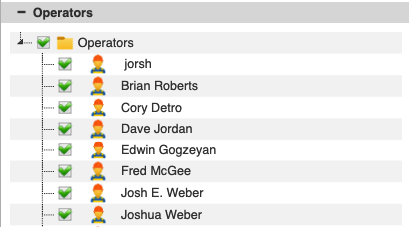
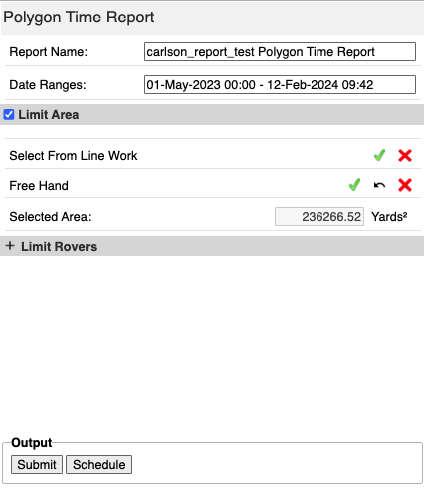
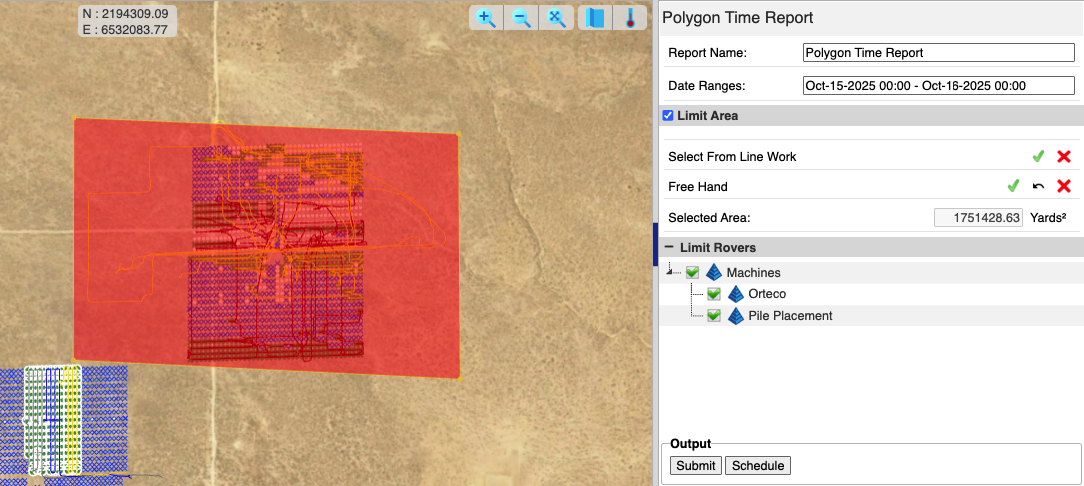
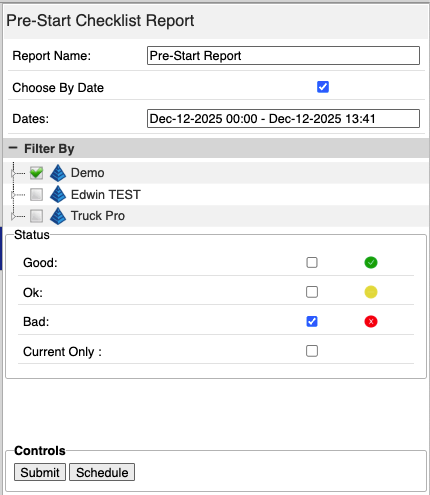
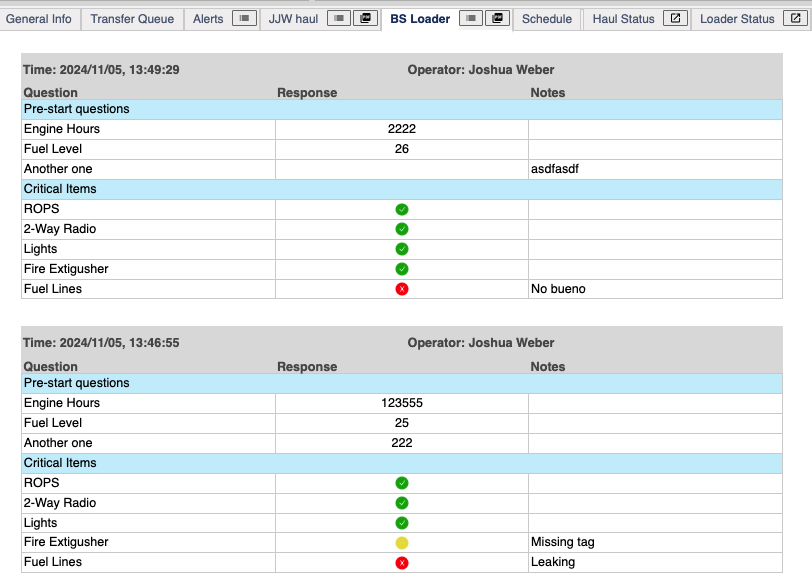
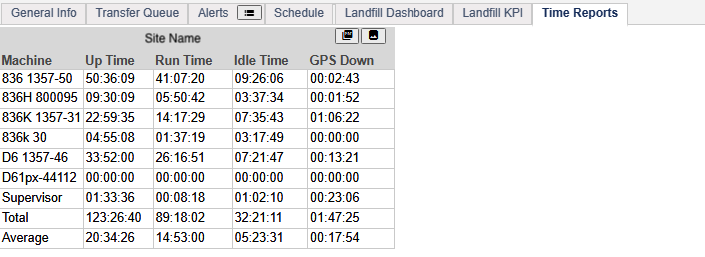
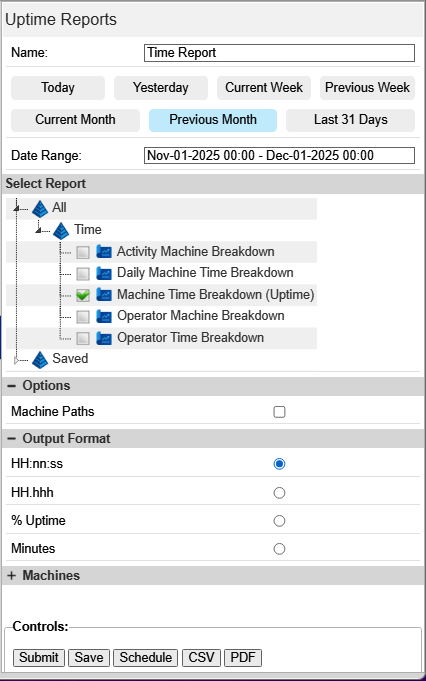
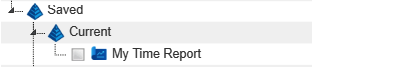
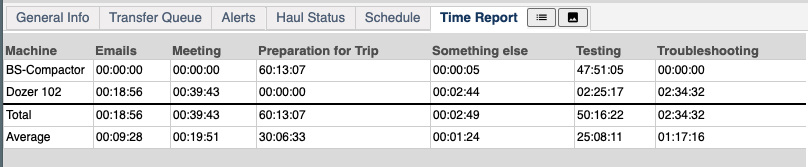
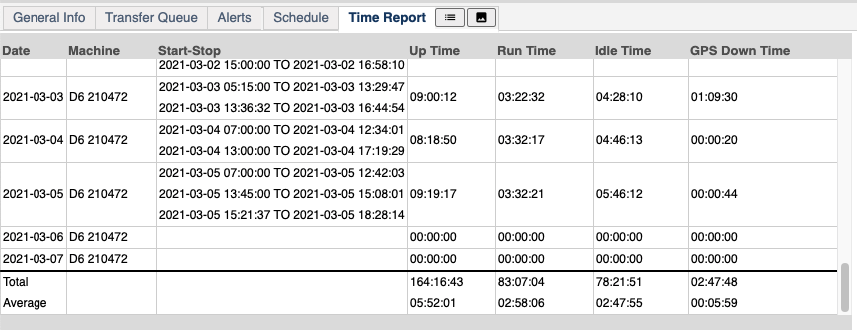
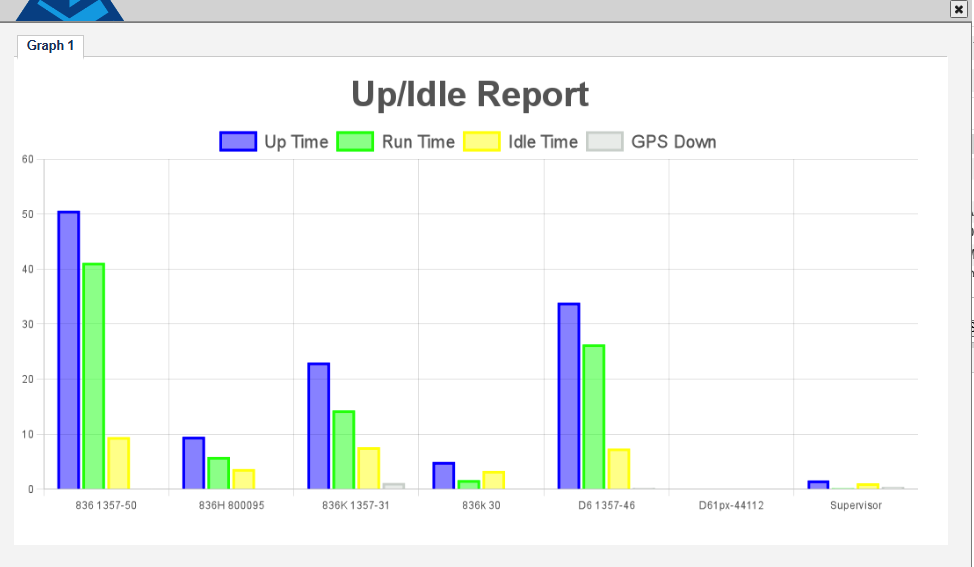
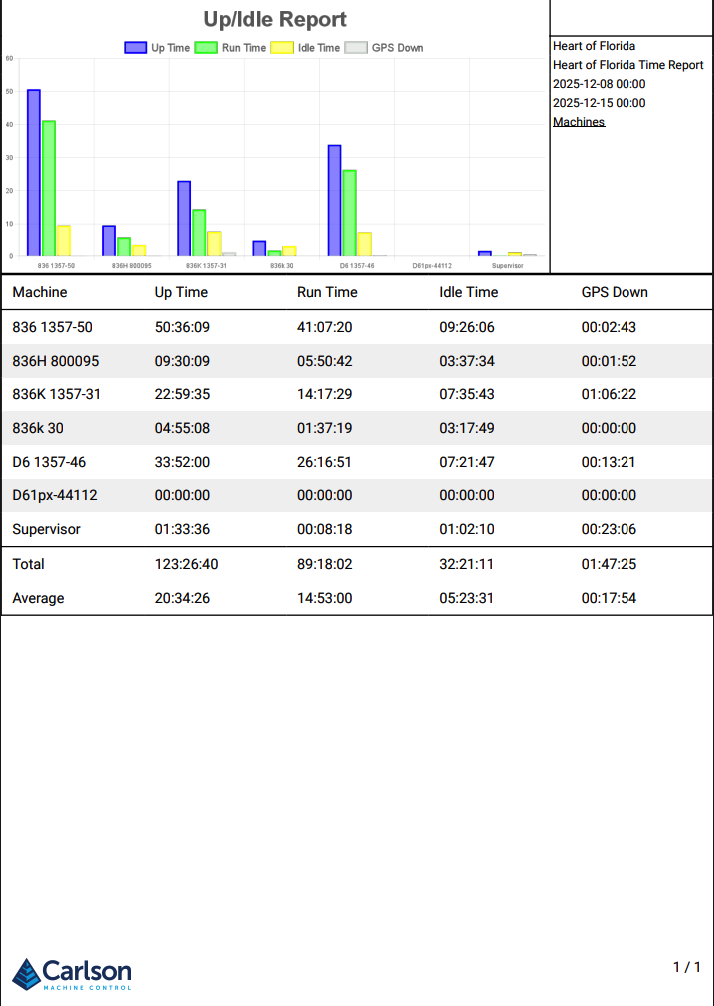
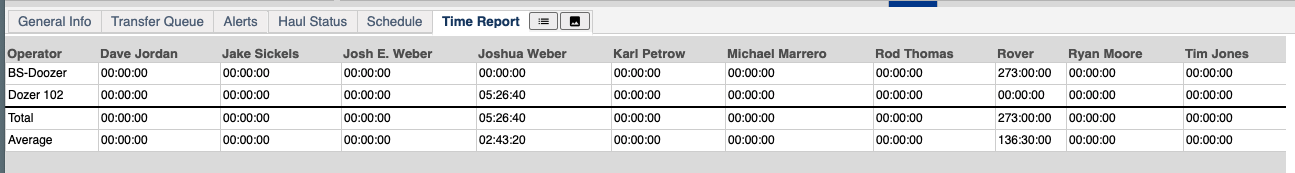
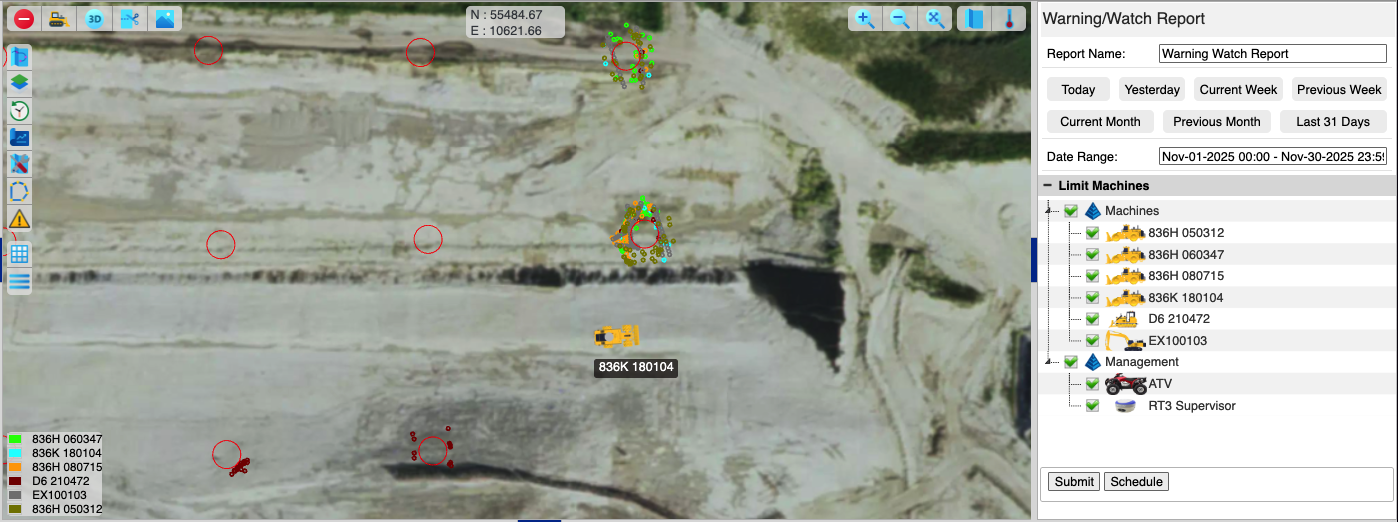
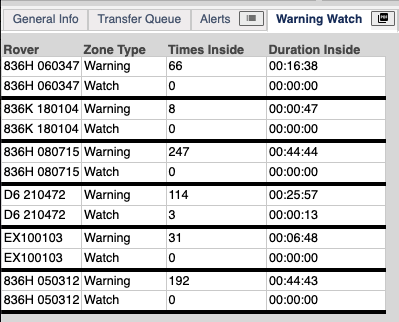
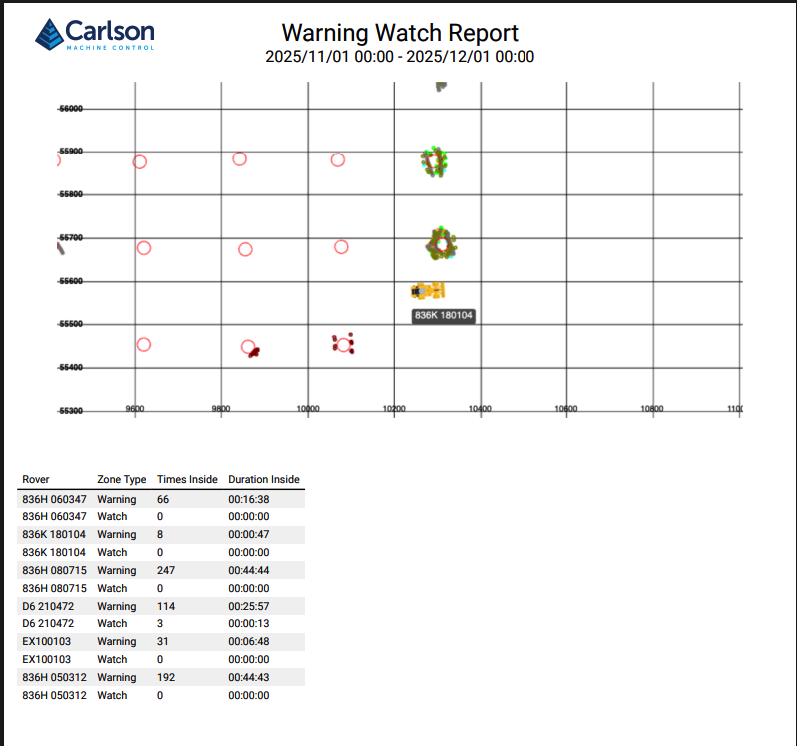
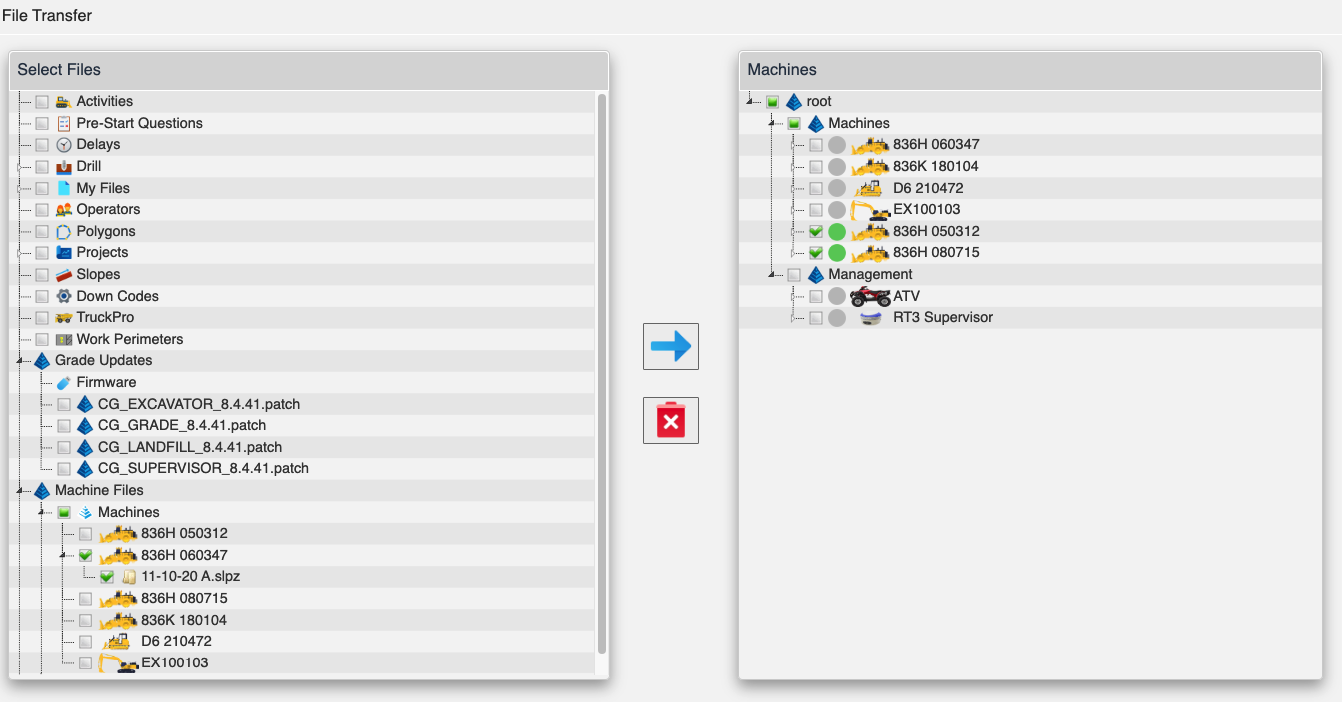
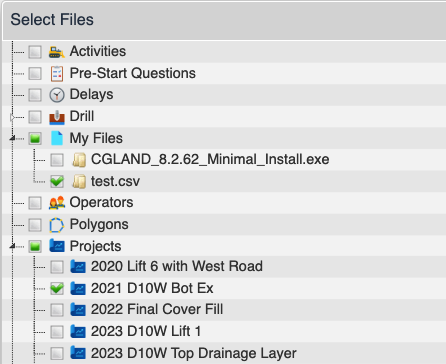
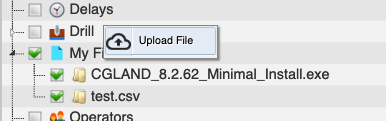
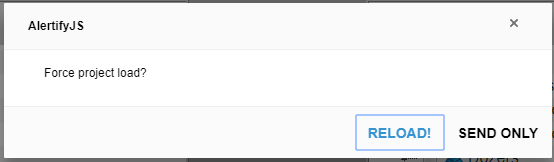
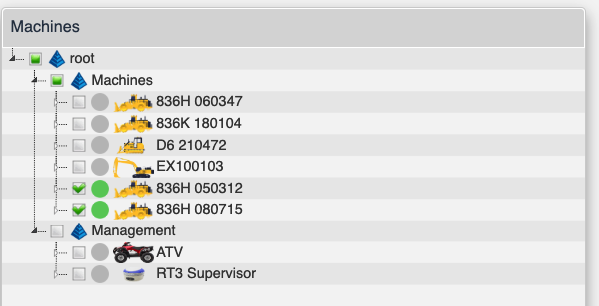
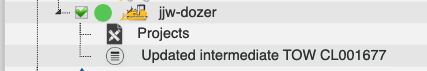
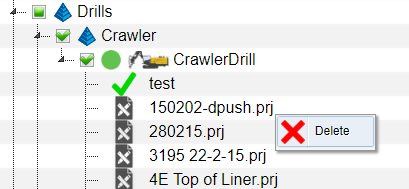

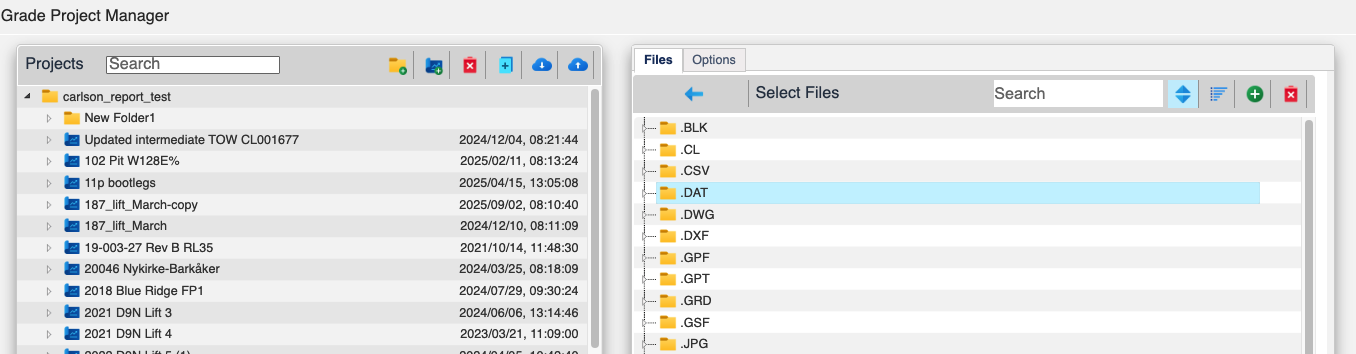


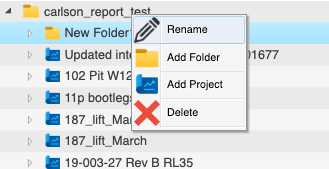
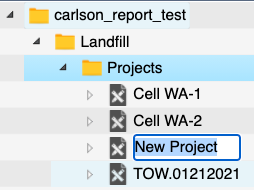
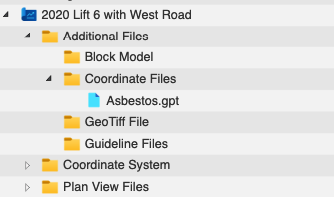
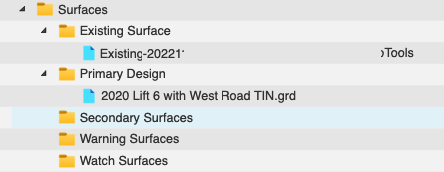


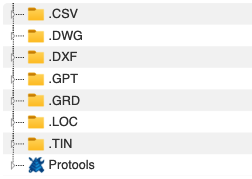
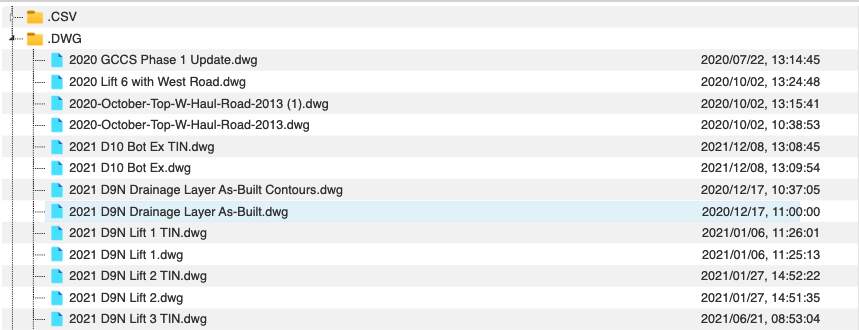
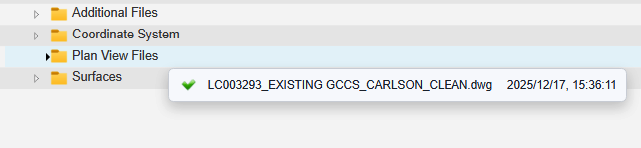
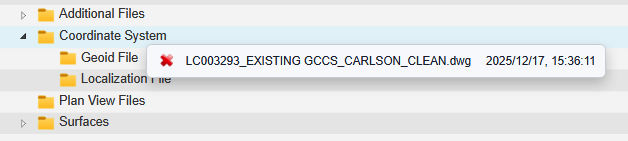
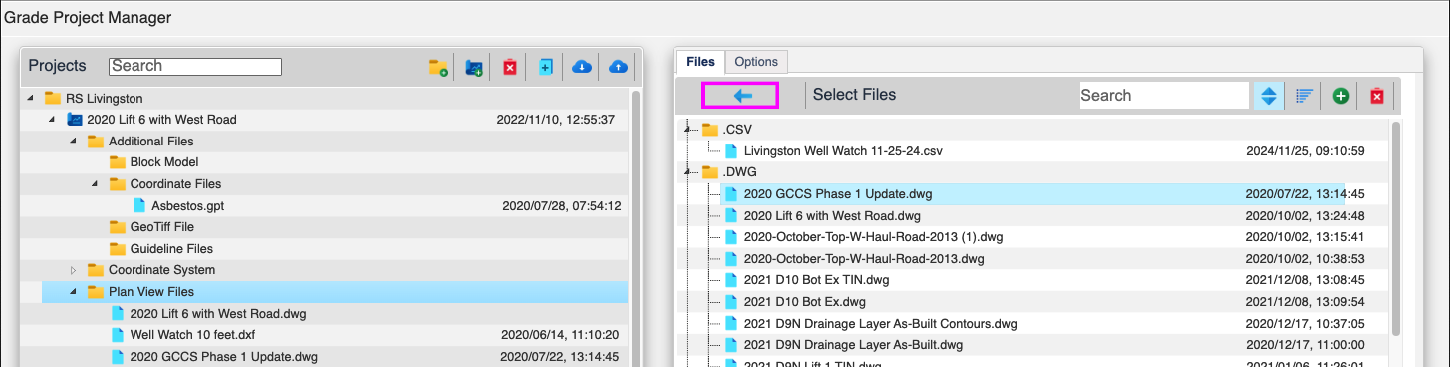
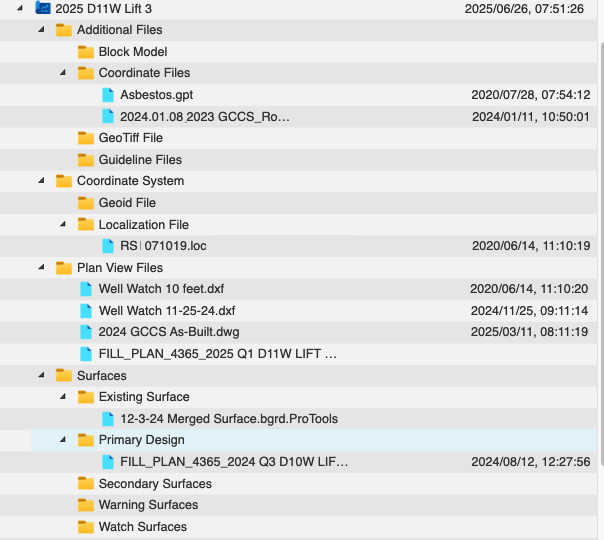
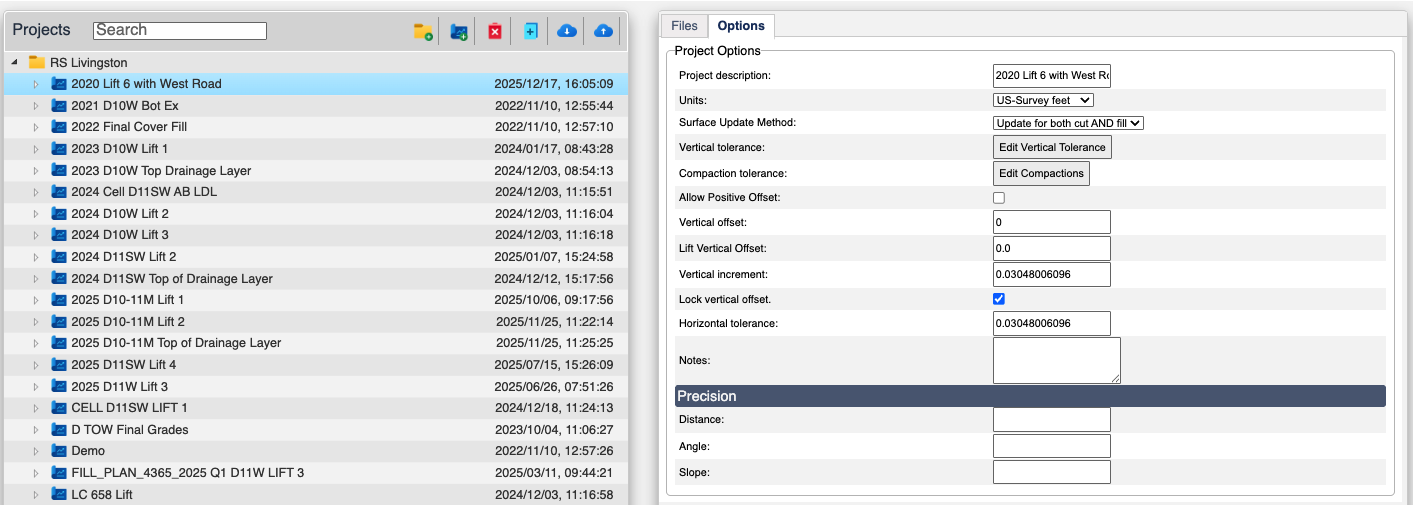
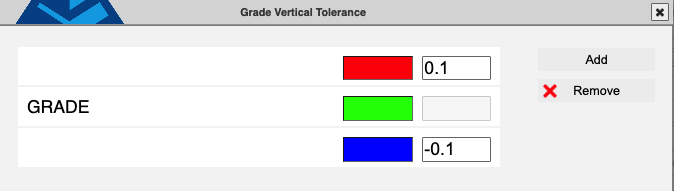
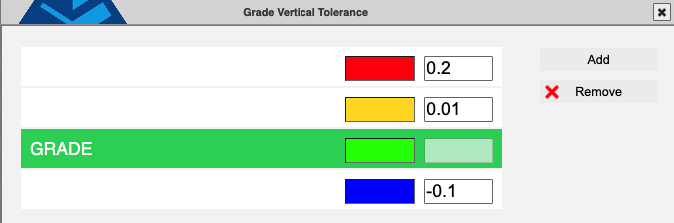
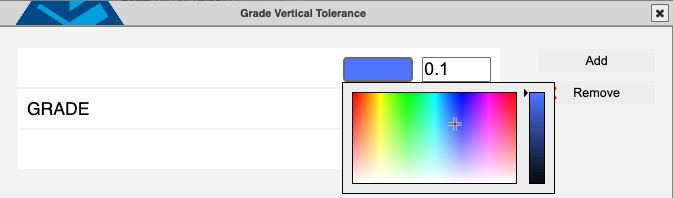
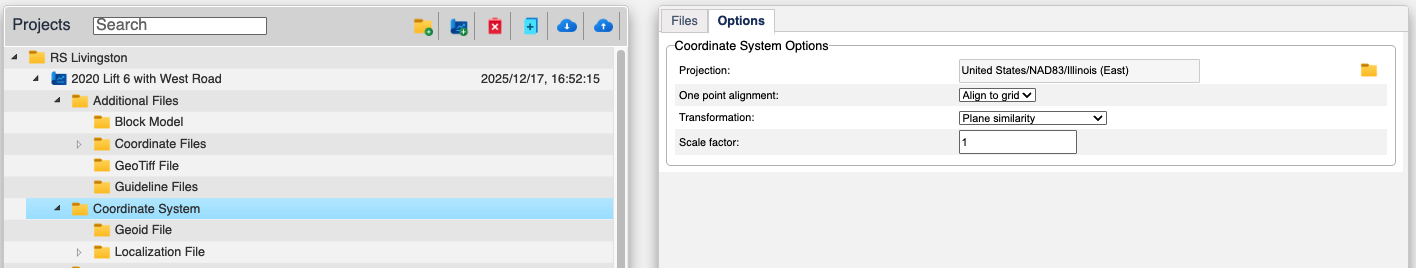
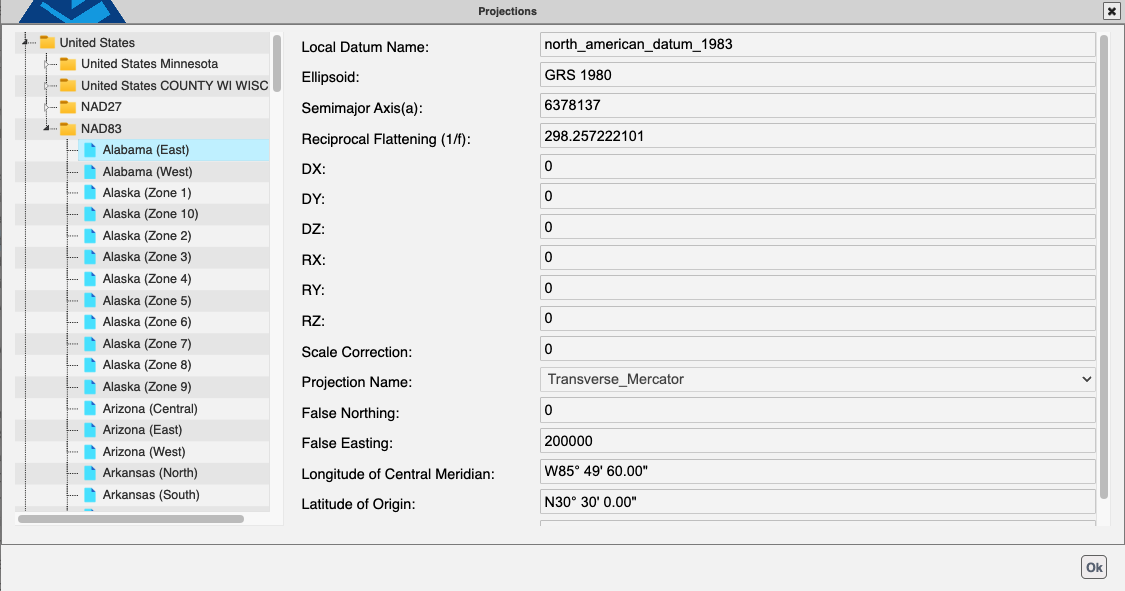
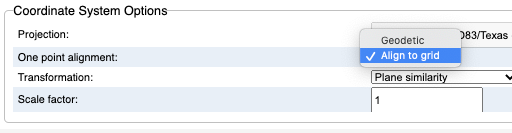
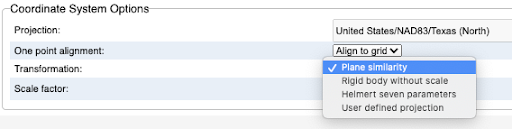
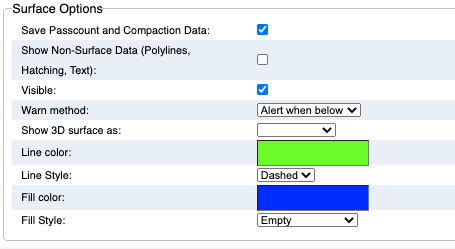
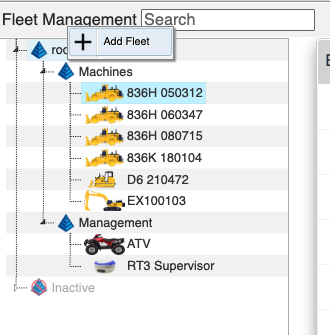
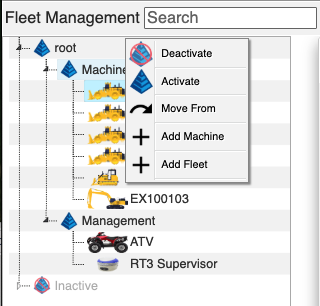
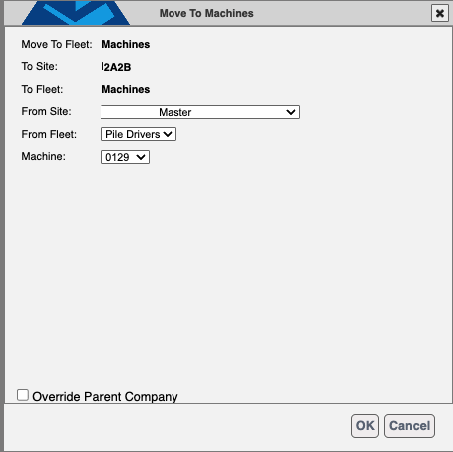
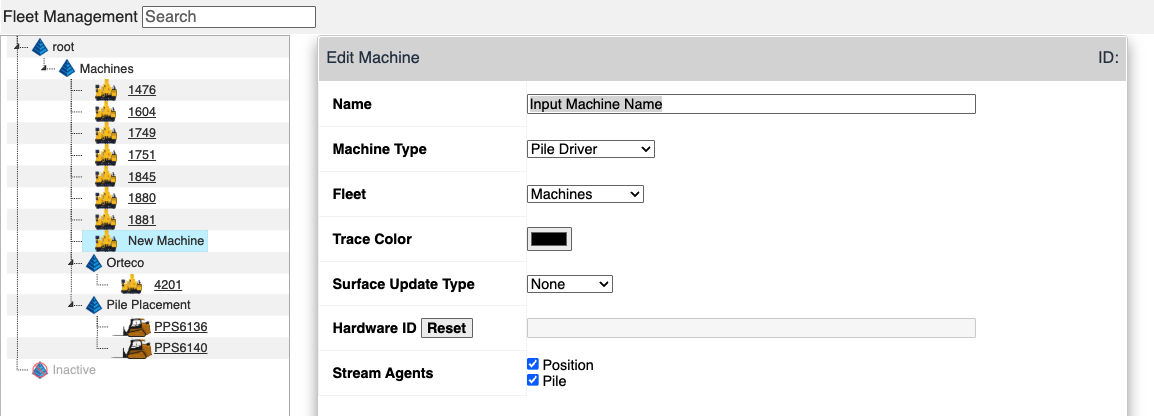
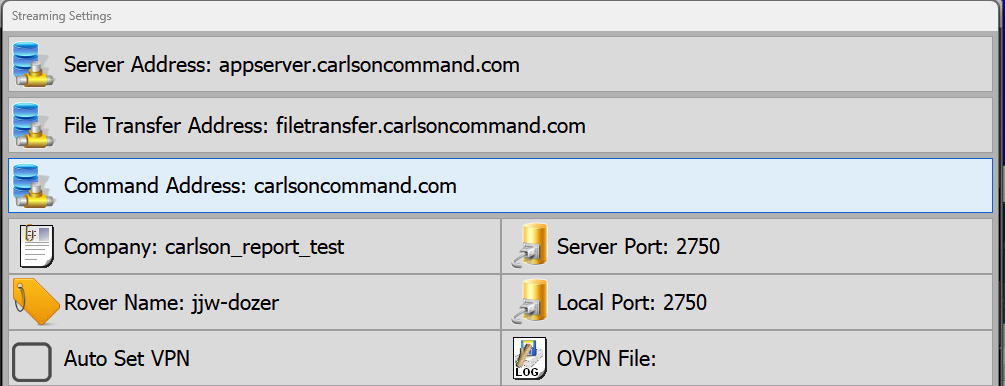

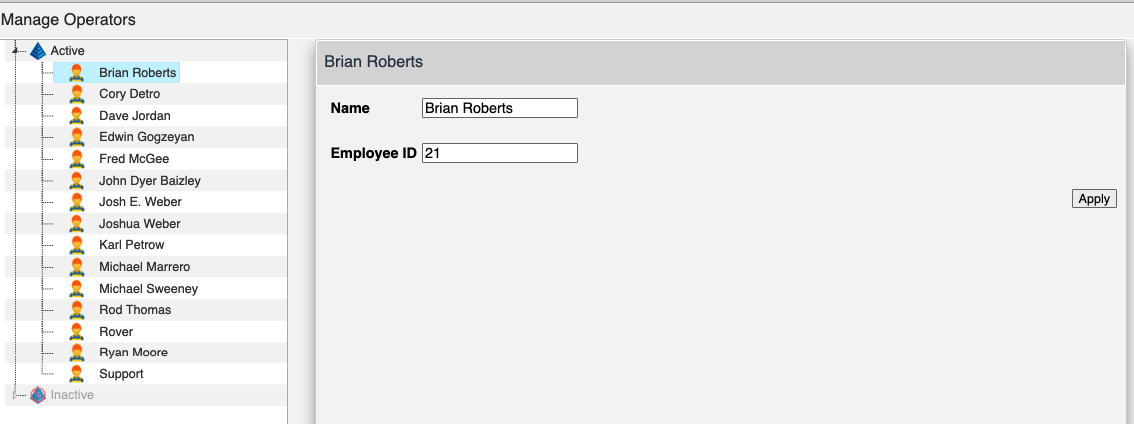
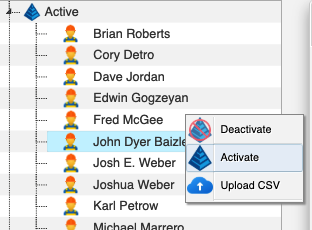
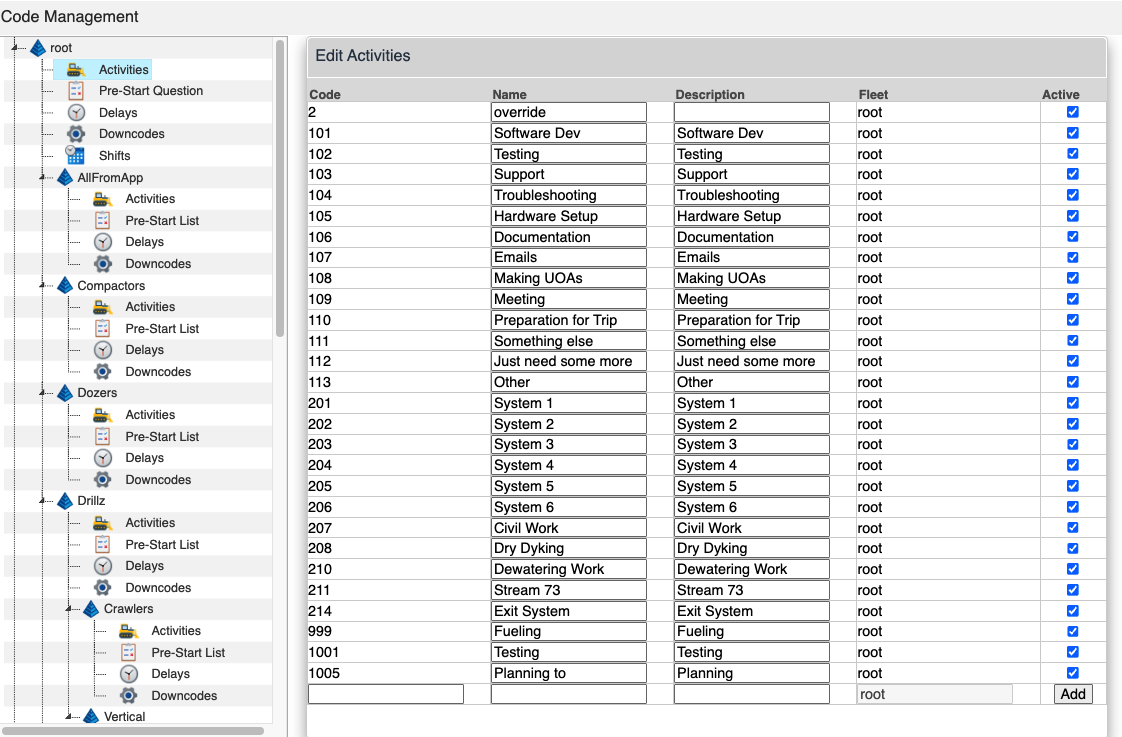
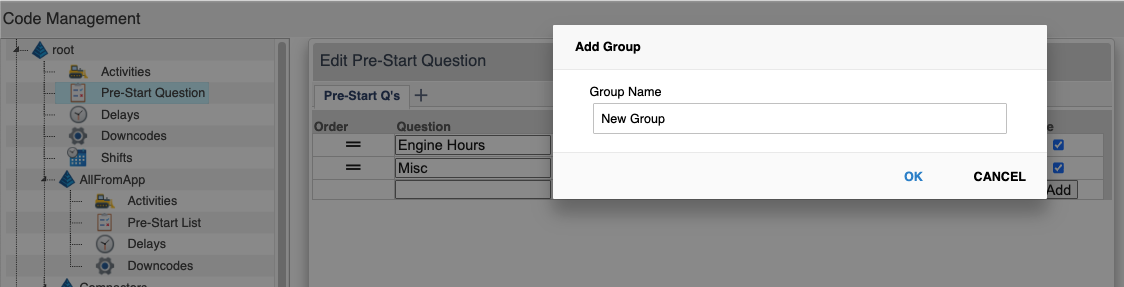
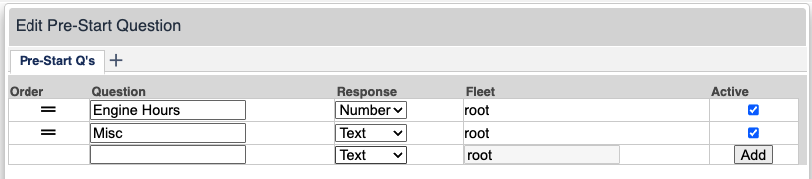
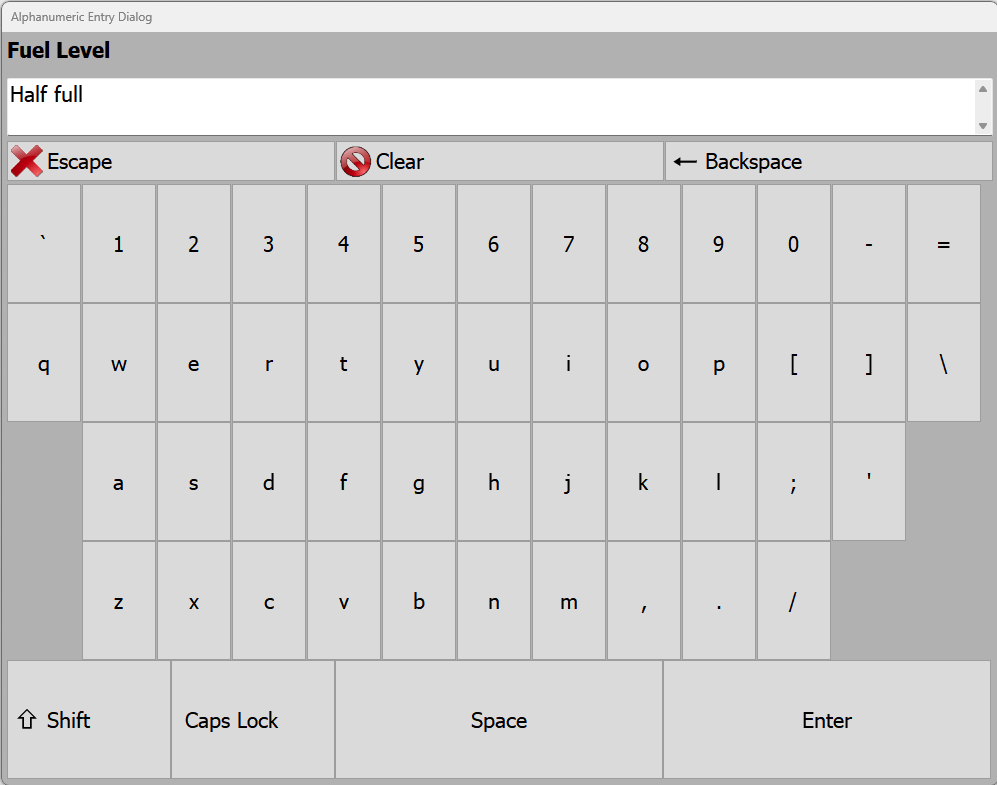
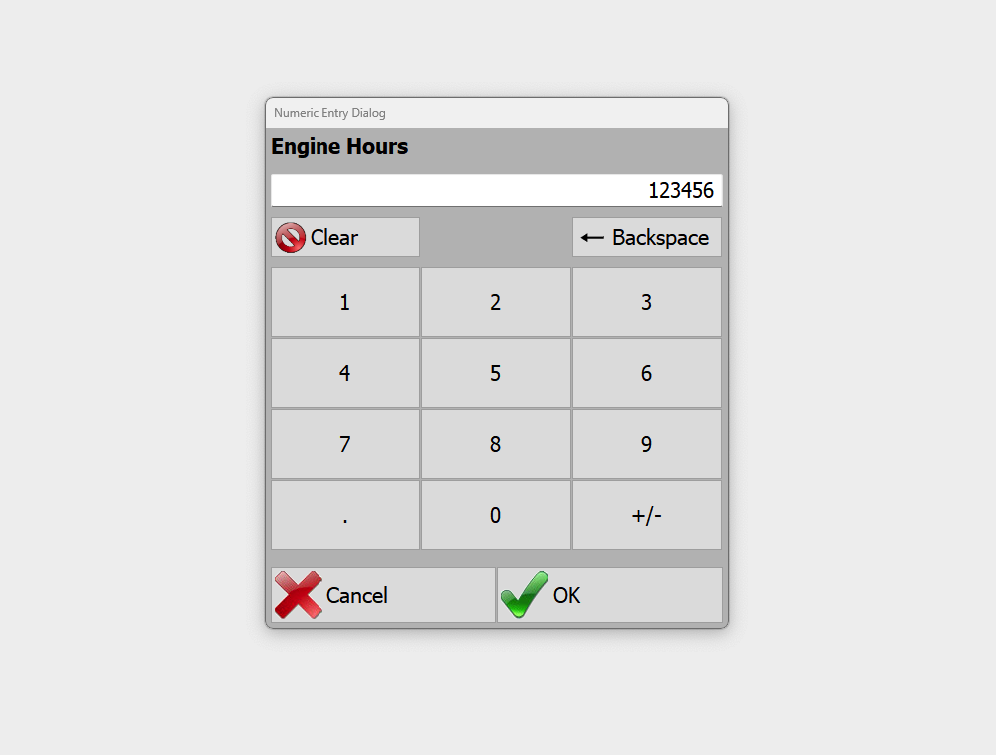
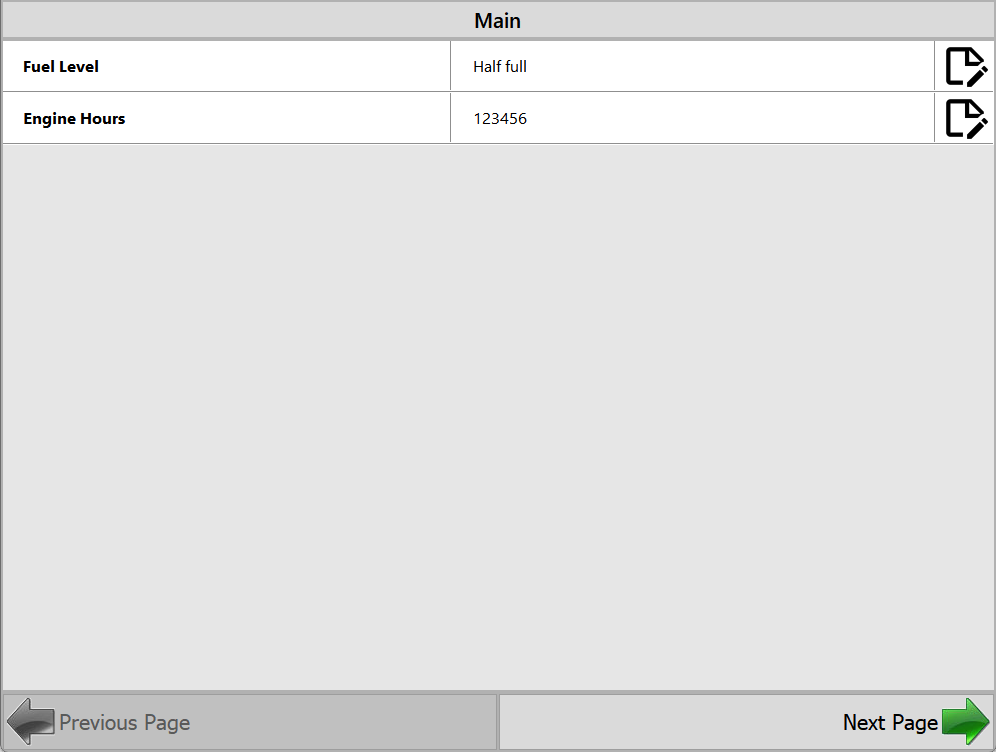
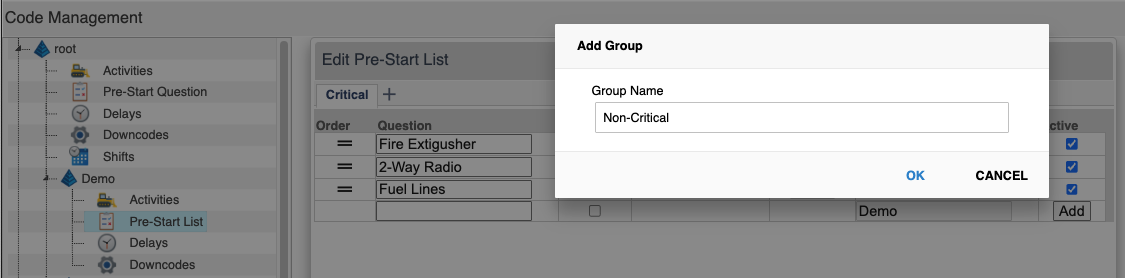
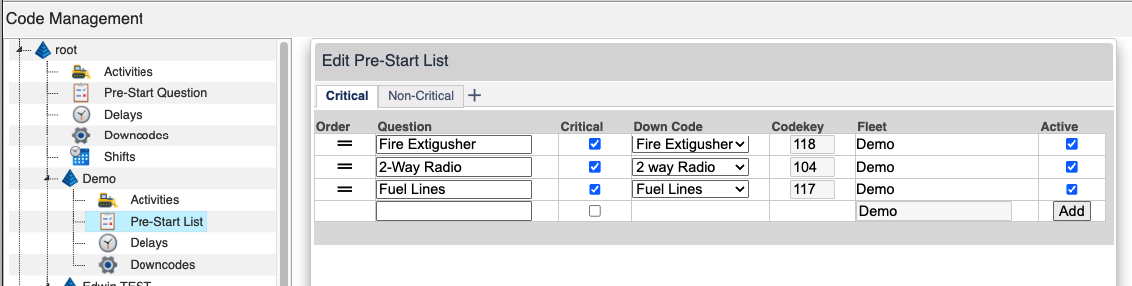
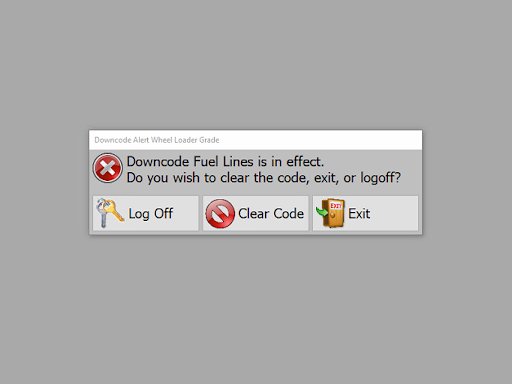
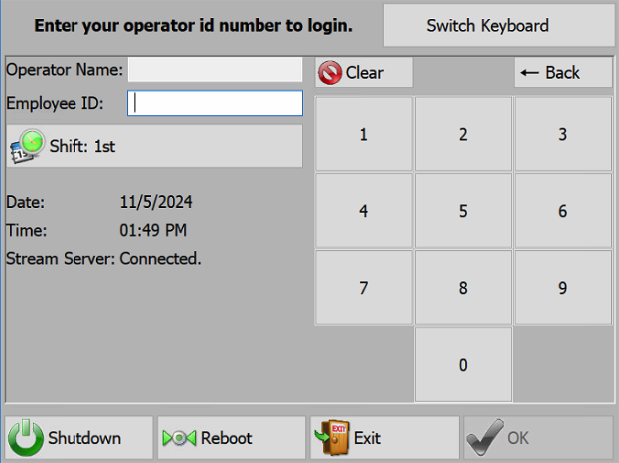
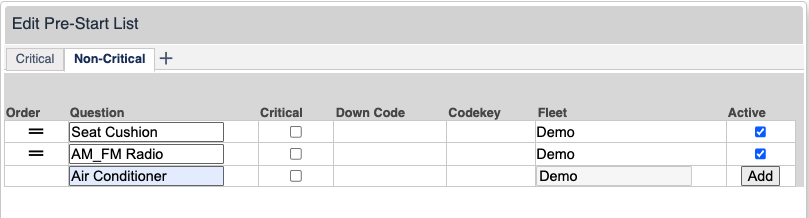
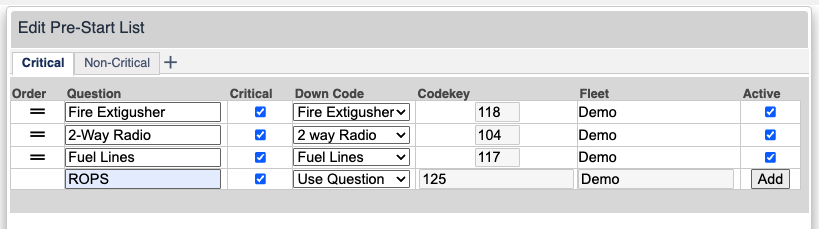
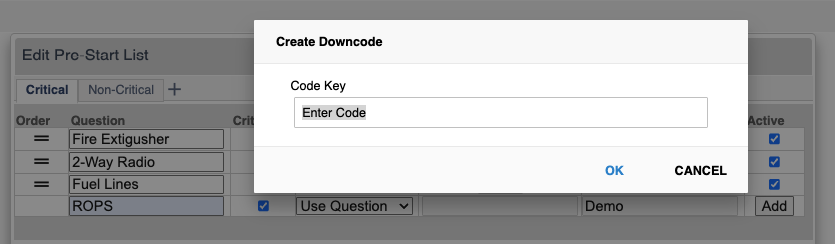
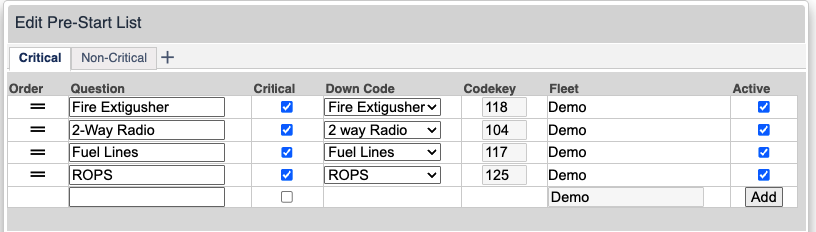
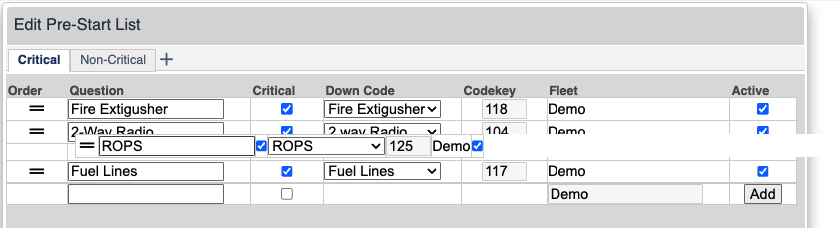
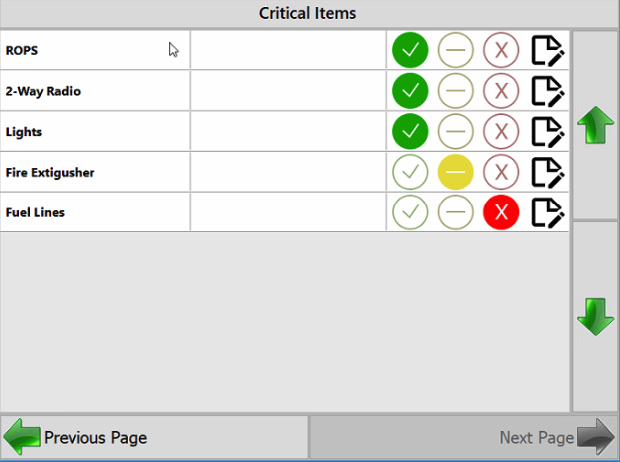
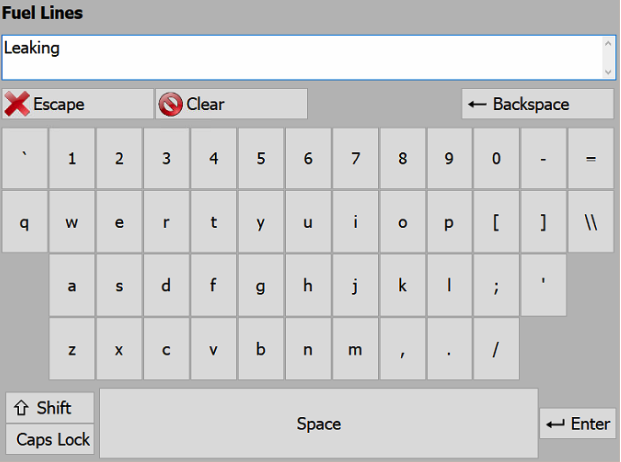
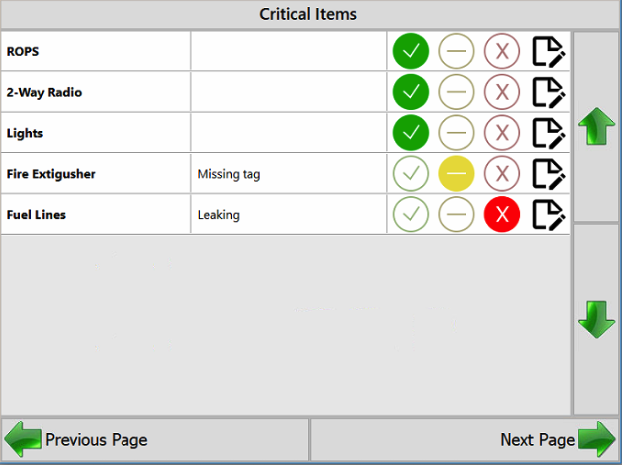
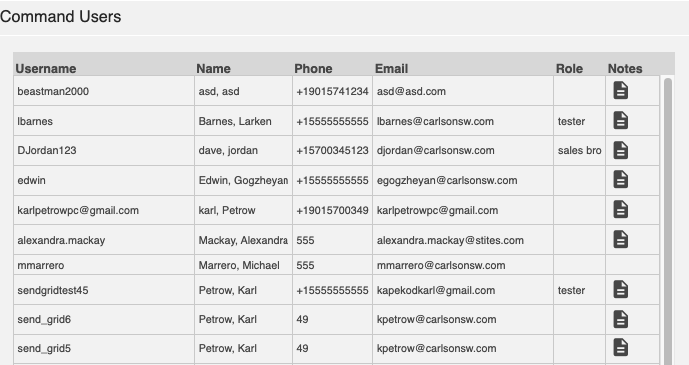
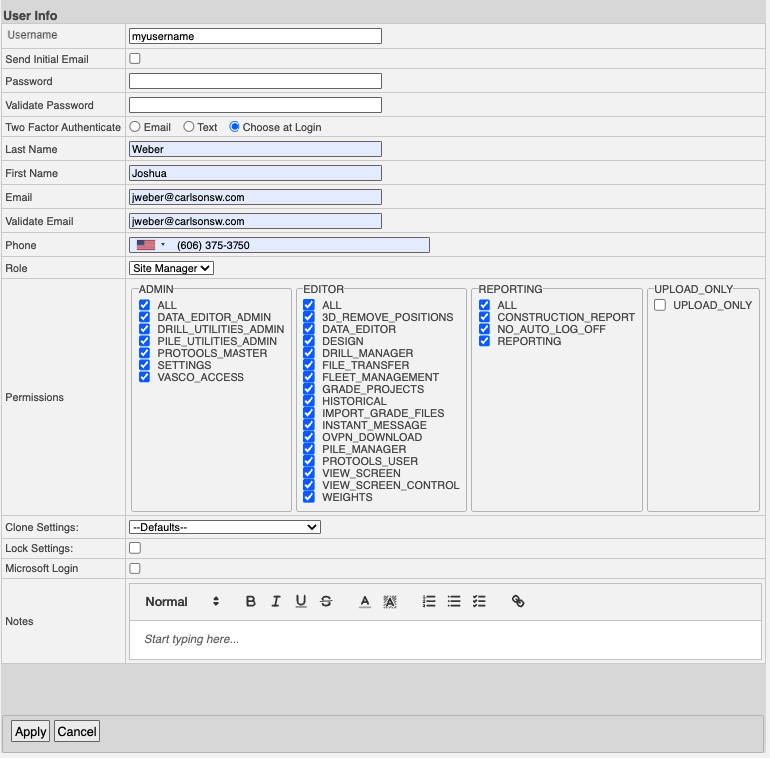
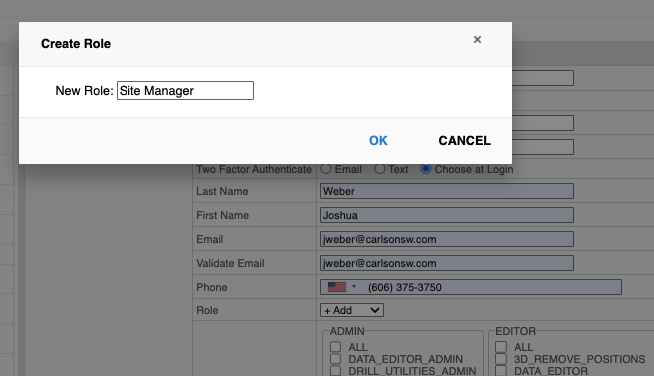
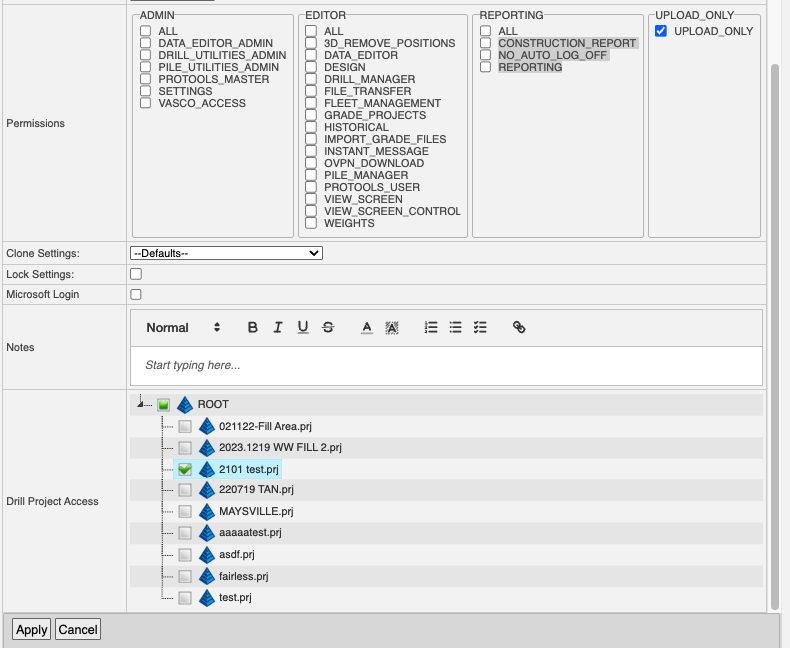
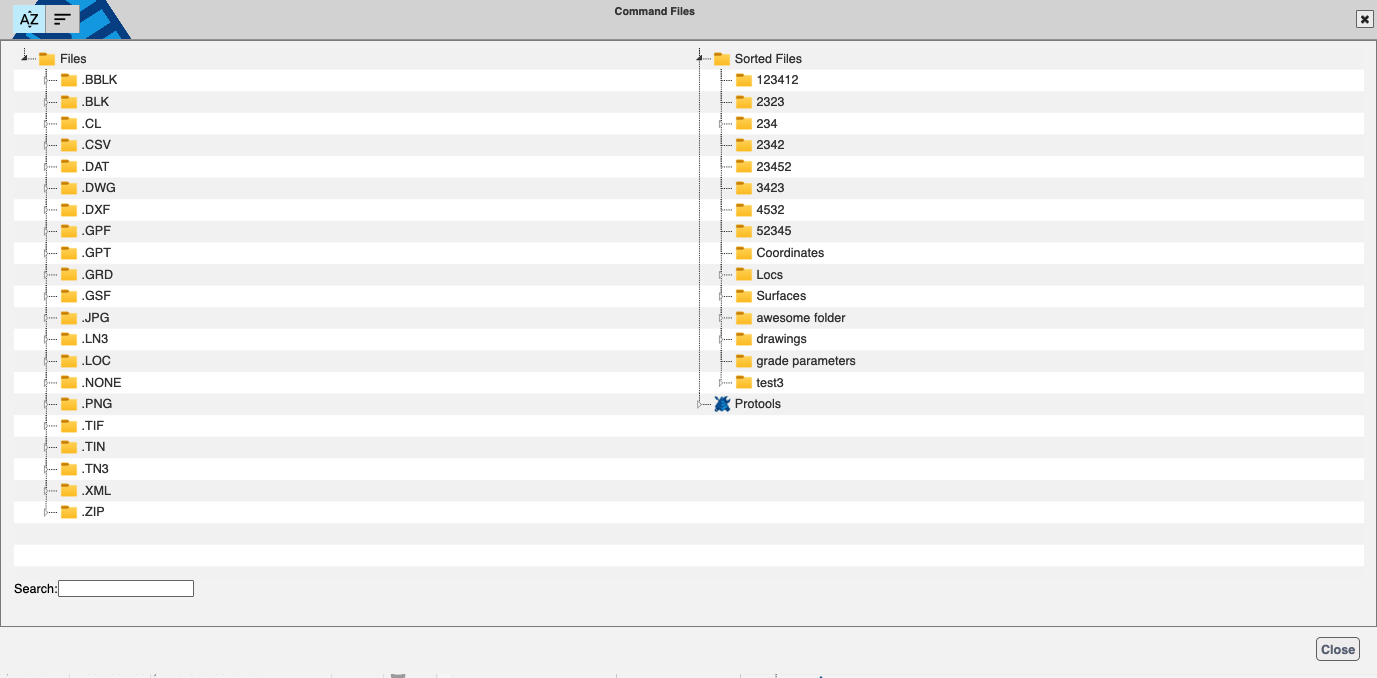
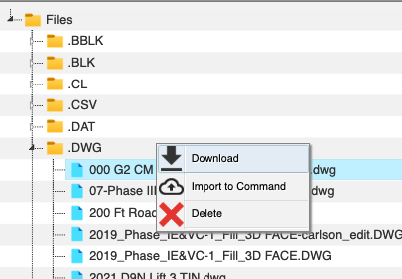
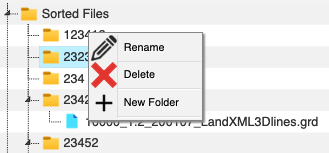
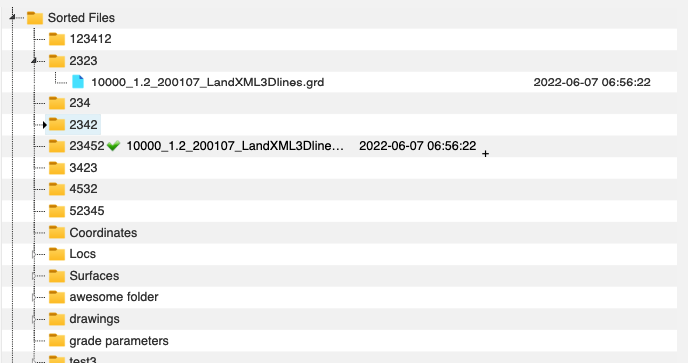
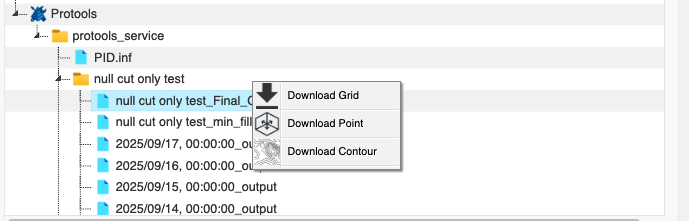
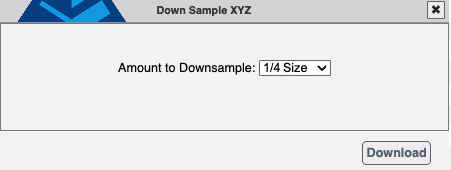

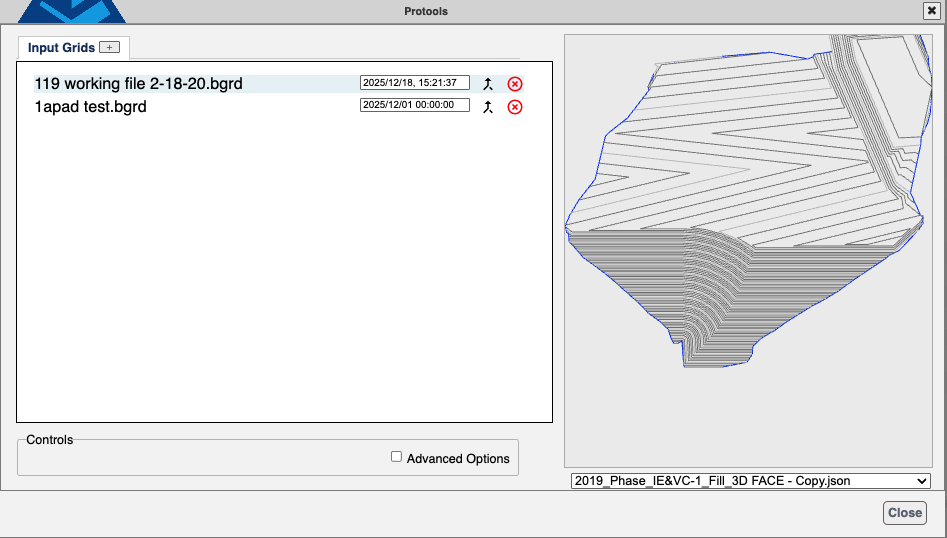
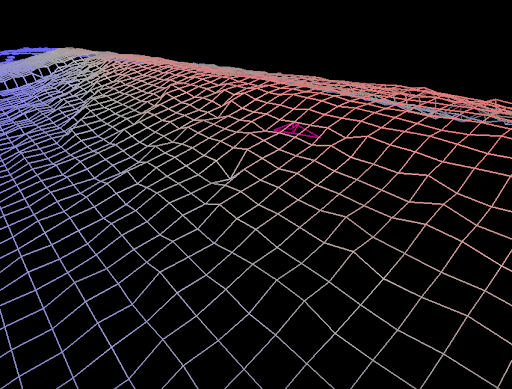
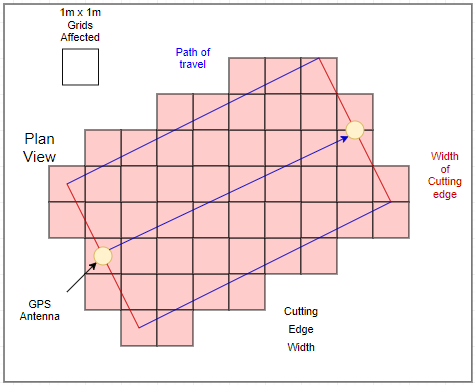
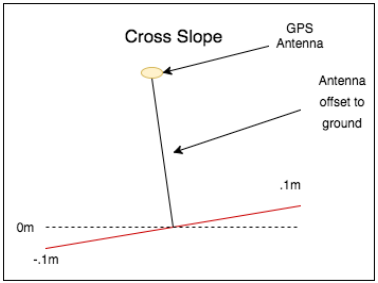
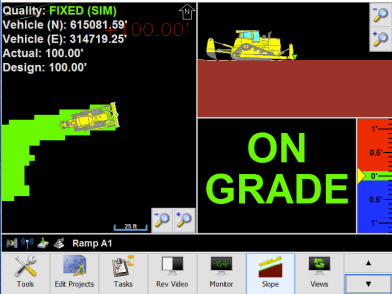
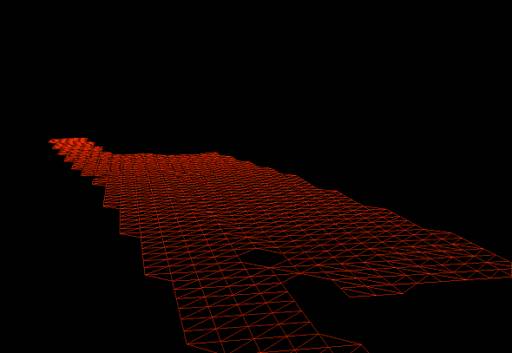
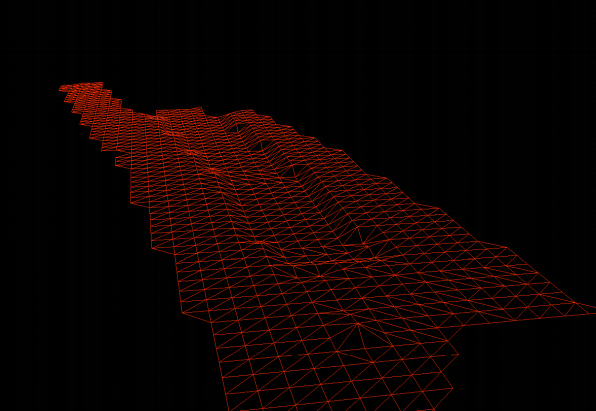
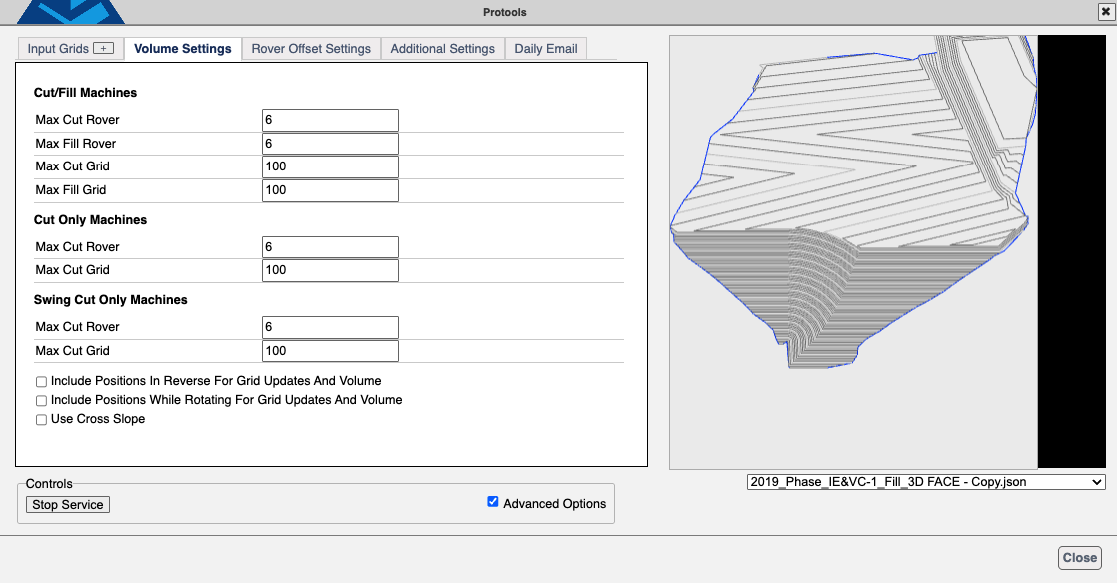
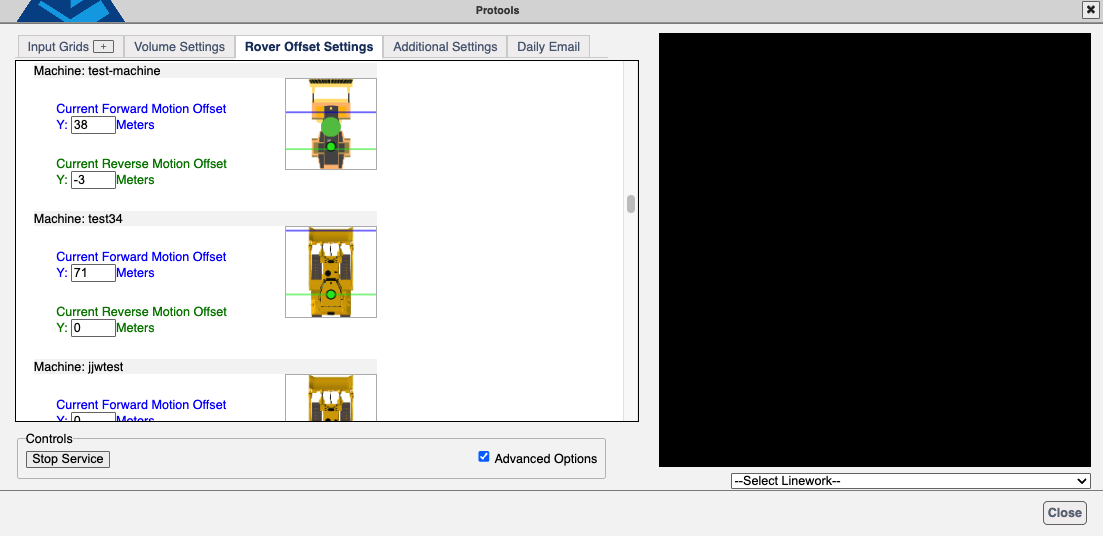
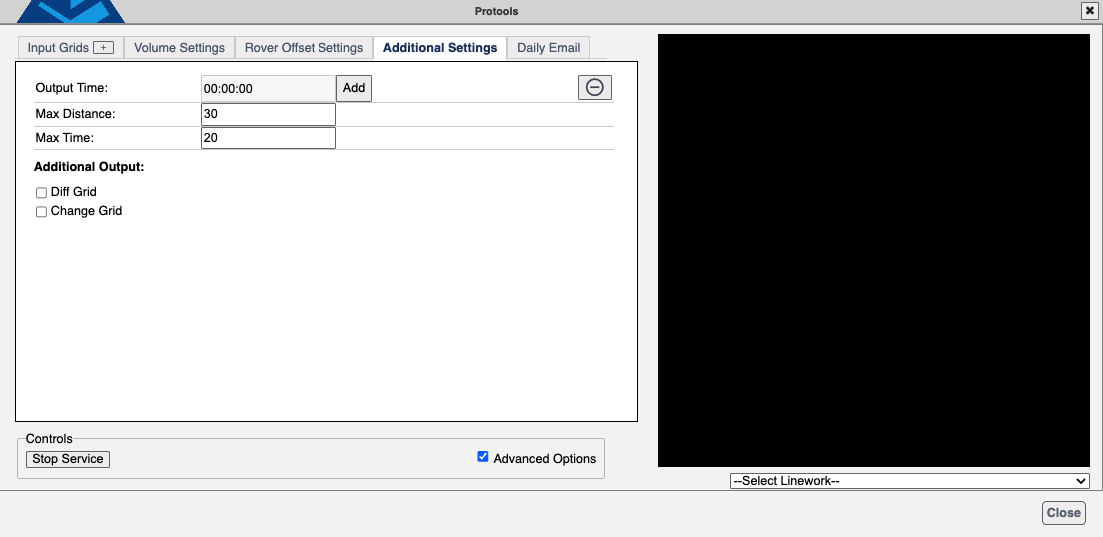
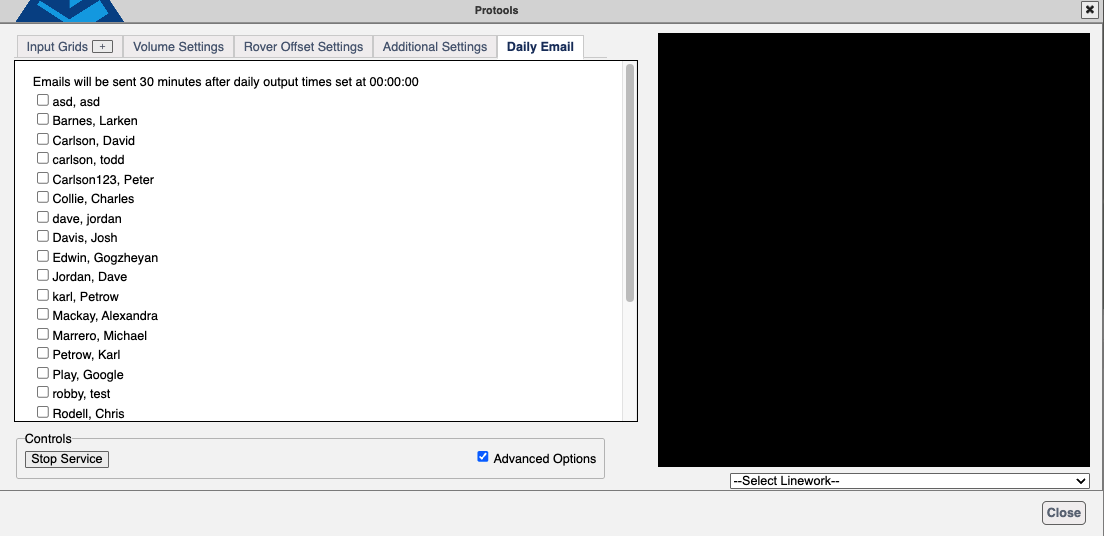
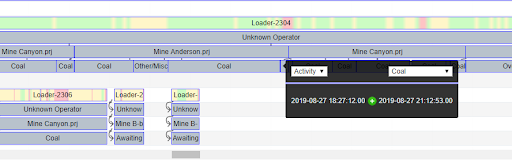
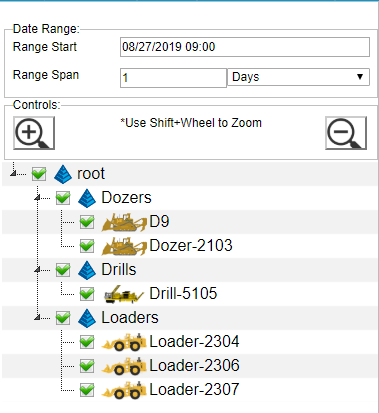
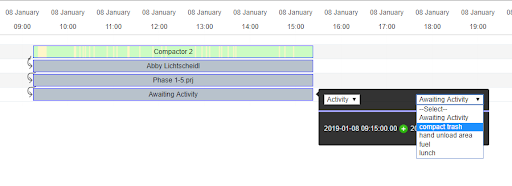
 Press the KPI button in the header to go to the KPI page.
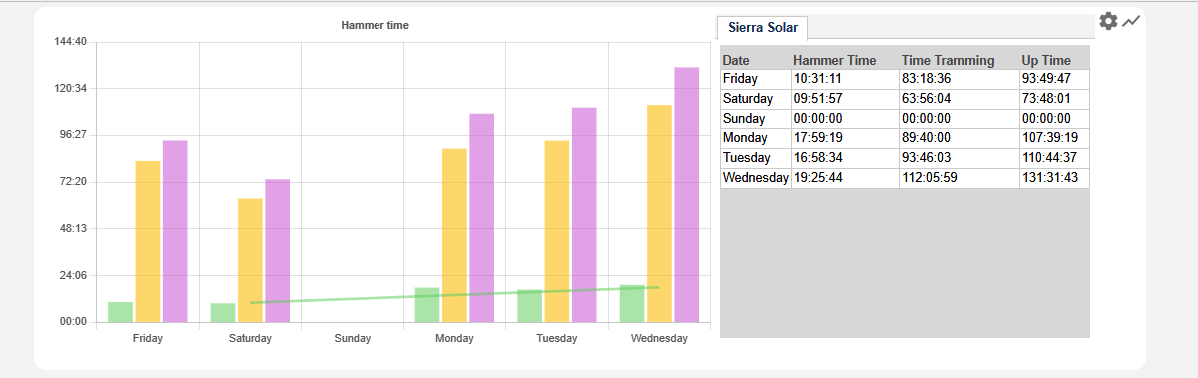

 Settings - Open the left settings panel.
 PDF - This button produces a PDF report of all charts and data configured on the page.
 Add - Located on the right side of the control panel.