Pass Count Report
This report displays the number of passes over each node of the base grid surface.
Note: Each movement forward, or back counts as one pass.
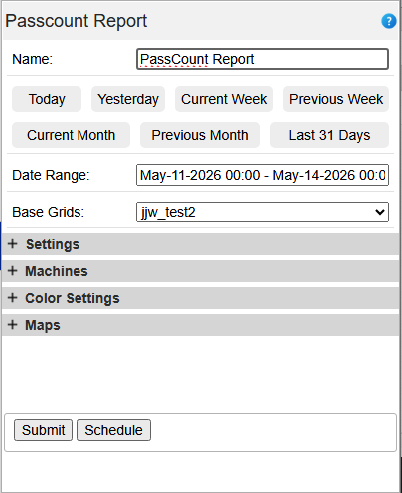
Start Date/End Date – Beginning and ending date/time of the report.
Base Grids –Select the grid to use for this report.
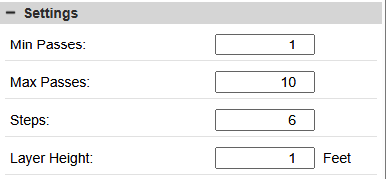
- Min Passes - The lowest number of passes that will register on the report
- Max Passes - The highest number of passes that will be calculated in the
- Steps - The number of colors in the speed map.
- Min Fill - This is the minimum amount of fill for the area that will be considered for the report.
- Layer Height - The height to divide the total height by to get passes per lift.
- d = depth of fill
- tp = total passes
- lh = Lift height
- For each grid node = tp/d*lh
- Then the % of the area covered during that time period that falls into each defined grouping will be represented in the output.
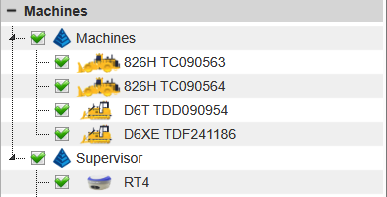
Machine Selection: Through this menu, users can designate which specific machines are factored into the report. By default, all machines are included; however, individual units can be selected or deselected using the checkboxes within the machine tree.
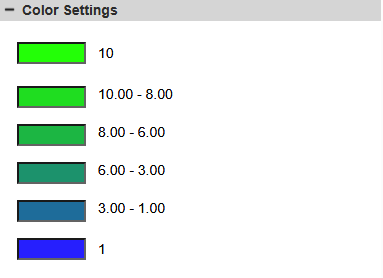
Color Settings: Adjust the Max Passes and Steps to define the color scheme for each pass level. By default, the system applies a blue-to-green color gradient to represent these levels.
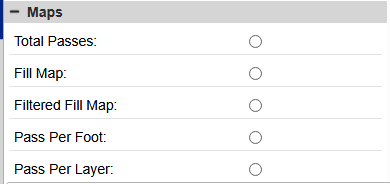
Maps:
- Total Passes -
- Fill Map -
- Filtered Fill Map -
- Passes Per Foot -
- Passes Per Layer -
Output
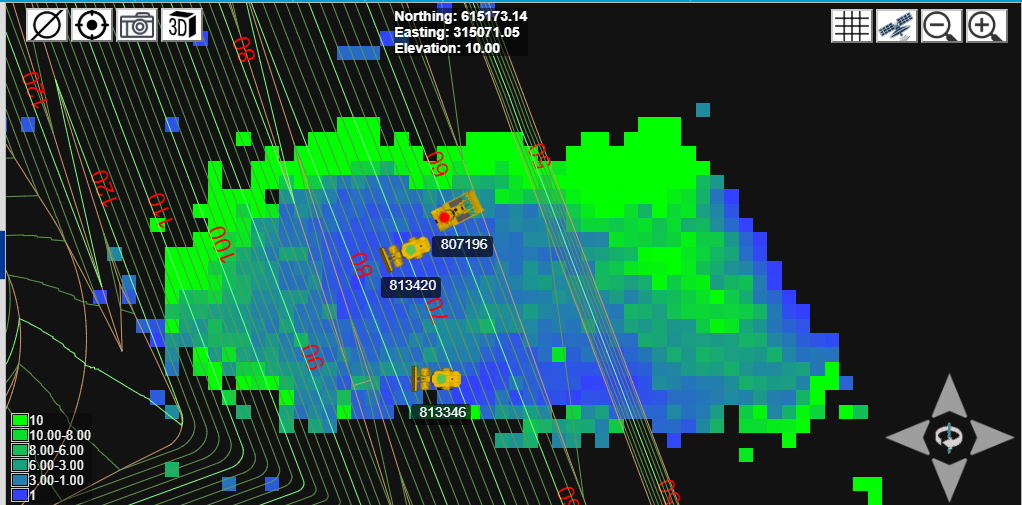
Plan View Screen
Pressing Submit will output a color map in the map view and report data in the details panel on a new tab at the bottom of the screen.
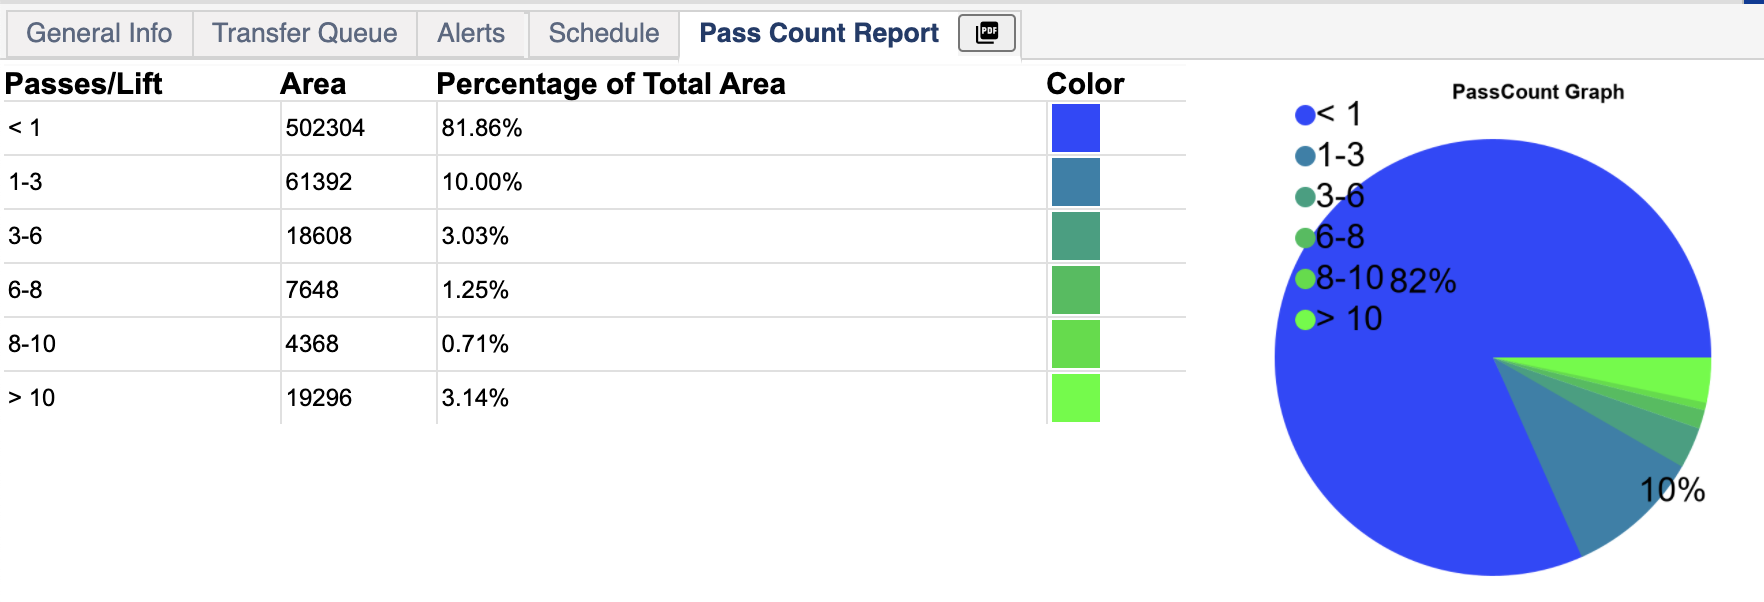
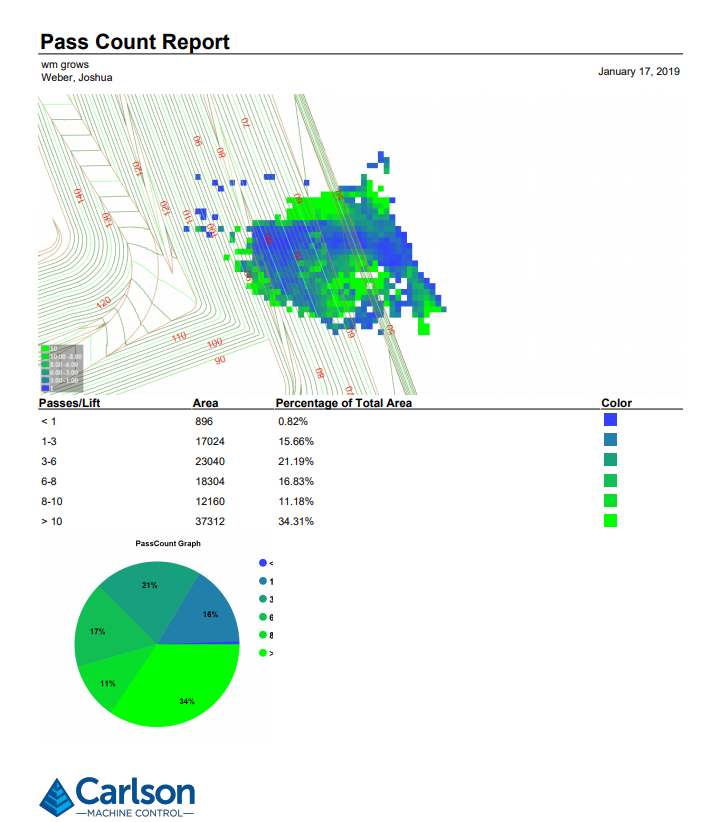
Passes/Lift - This is the number of passes broken down into how much of the area was passed over this many times.
Area - The total area that has been passed over this many times.
Percentage of Total Area - How much of the area that has been passed over this many times.
Pressing the PDF button on the tab will download the report in PDF format. Command will take a screen capture of what is in the map view at the time the PDF button is pressed. This capture will be used as the image at the top of the PDF report. The chart and the graph will be shown below