Controls
- Submit - Run the report with all of the selected options. Data will load in several places.
- Fast Total - Quick report that produces the total number of piles driven per machine, and overall on the site. Designed to give a quick result with minimal input.
- Schedule - Open the scheduling menu to schedule a pile report for automatic email.
- Download - Download the type of report selected in the “Download Format” section.
Submit
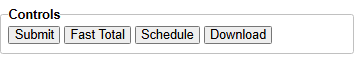
Map
The piles are plotted on the plan view. The legend references the colors of the piles. Green piles are in tolerance, red piles are out of tolerance, white is for designs and blue is refusal.
Details (Bottom) Panel

The Pile Reporting tab in the Details panel shows a summary of pile data for the time period or folders run. It is grouped in the first column based on the Display Options>Group By selection. The metrics shown are selected in Display Options>Table Metrics. The metrics are totaled for the last selection on the bottom row. The “PDF” button on the tab will download the Table metrics as a PDF file with a utilization report (see next section for details).
- #Piles - Total number of as-built piles.
- Hammer Time/Average Hammer Time - Time spent hammering or driving piles.
- Travel Time/Average Travel Time - Time spent traveling between piles.
- Out of Tolerance - The number of piles that did are not driven within the tolerances set for the report.
- % Tolerance - The percent of piles that meet the tolerances set for the report.
- Refused - Total number of piles that met the tolerance for refusal.
- % Refusal - Percent of piles that met the tolerance for refusal.
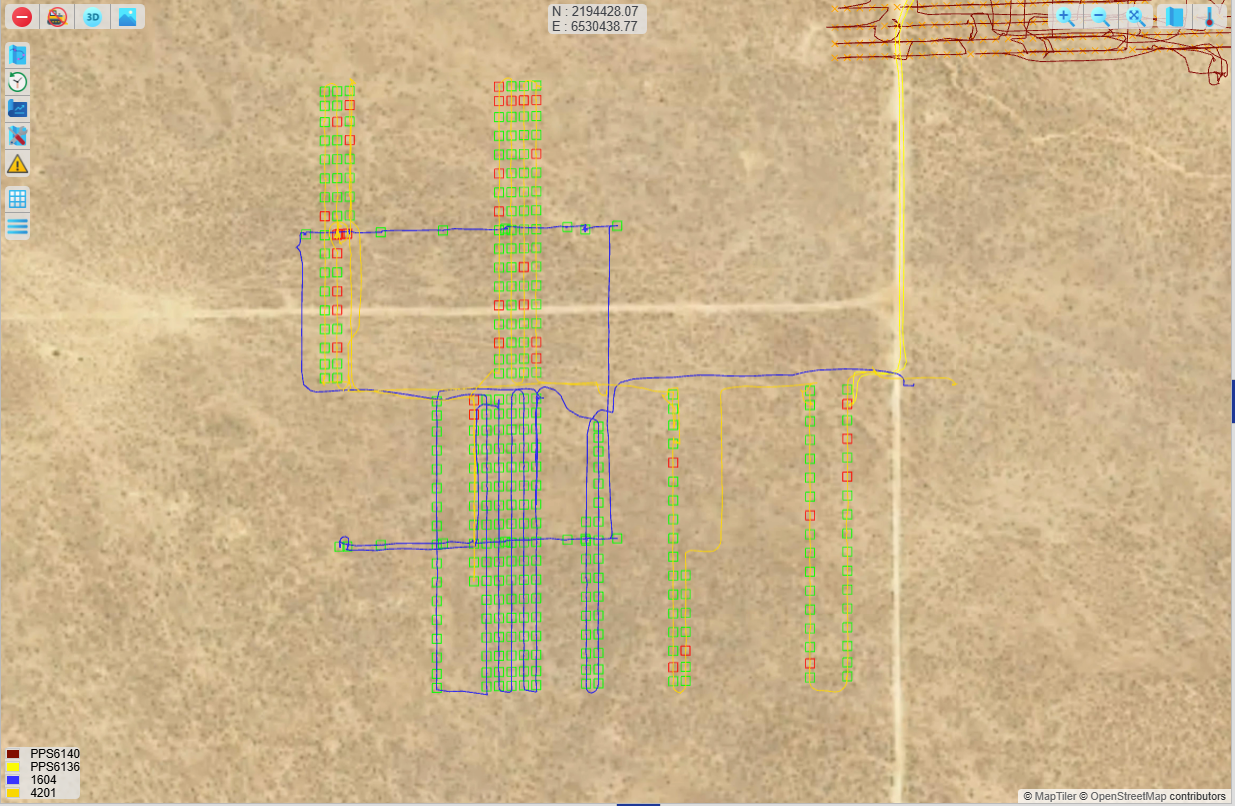
The Pile Details tab shows all of the data for individual piles. Select a pile from the map or use the “Right Click Select Details” option in Show to drag select multiple piles.
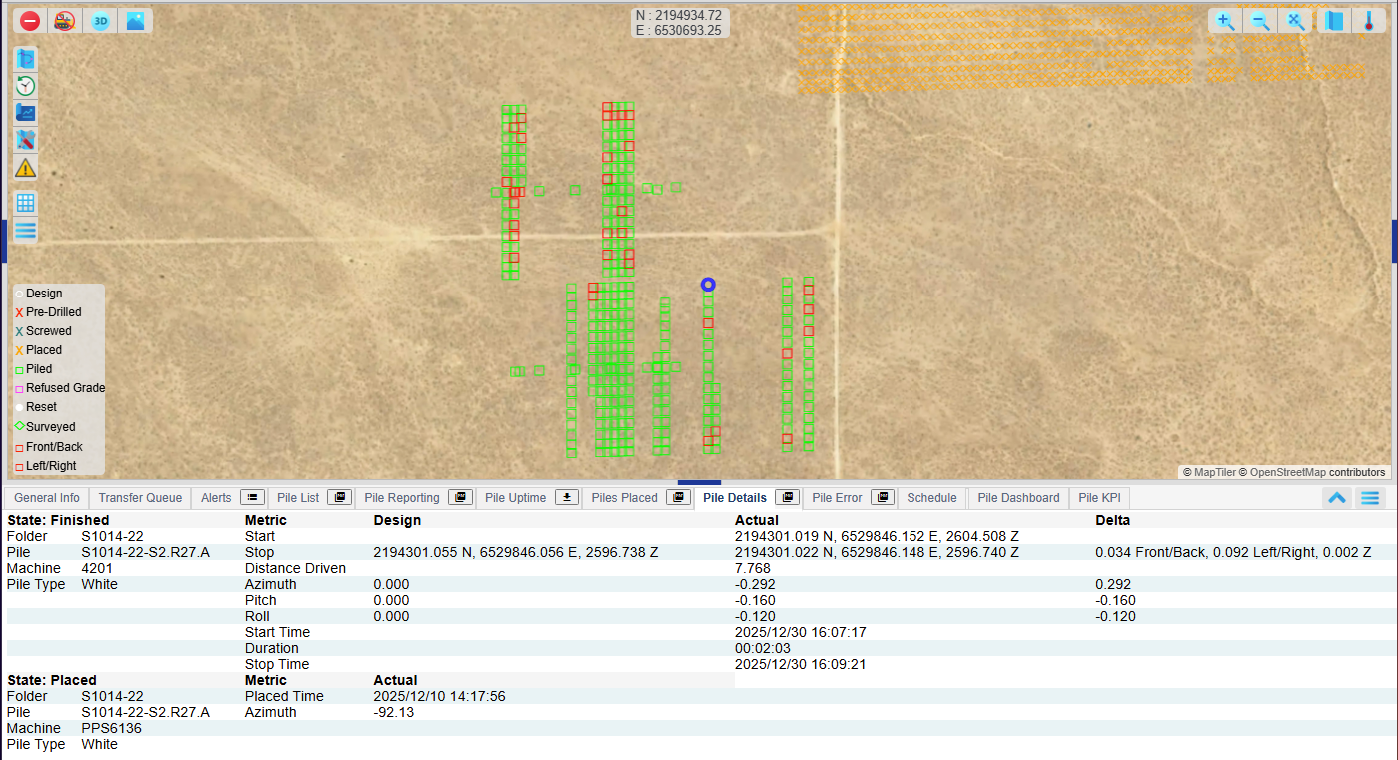
Fast Total
Download (after submit)
Download a formatted version of the report. Select a format from the “Download Format” section.
CSV - Raw output of metrics for each pile. Columns chosen from “CSV Metrics” section.
PDF -
Pile Summary - PDF with Utilization And breakdown chart.
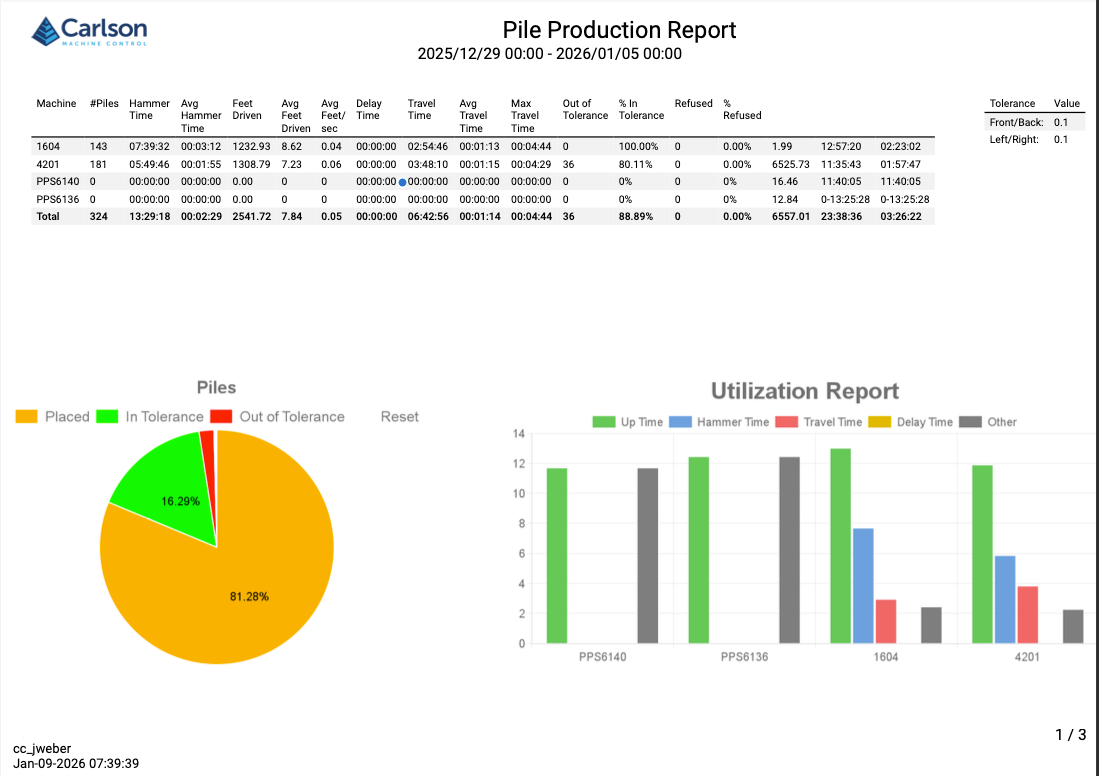
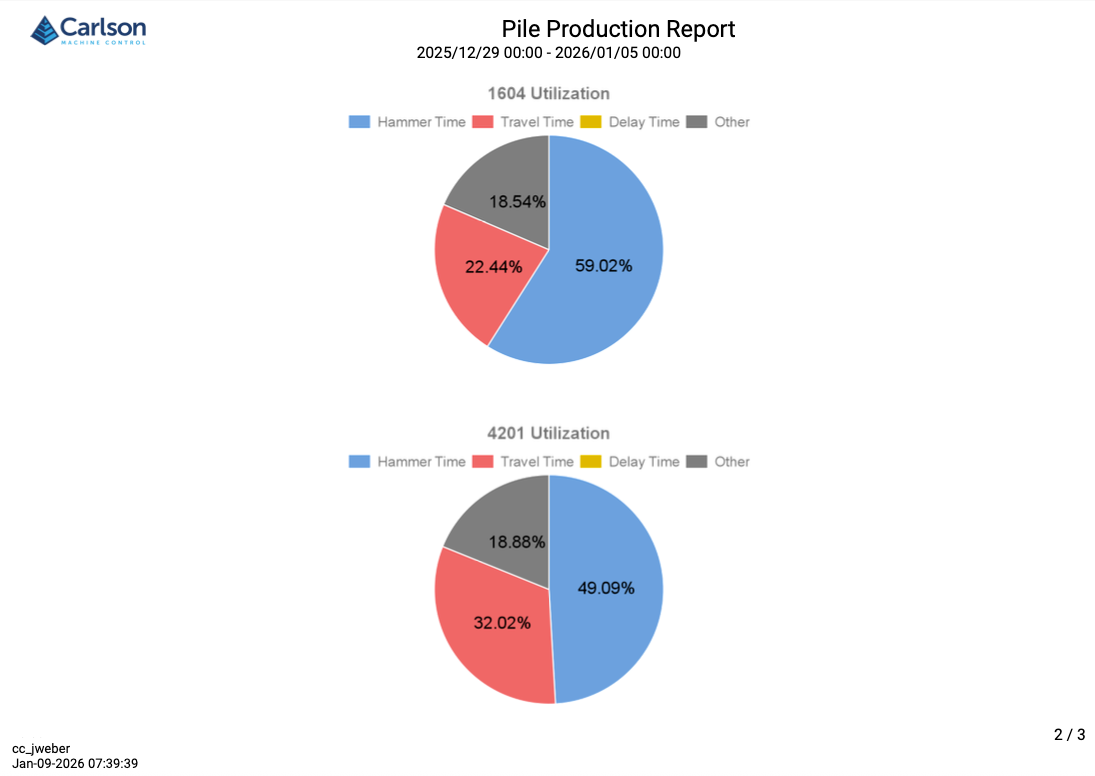
Utilization Report
- Uptime - All of the time PD Grade was running.
- Hammer Time - Time spent hammering or driving piles
- Travel Time - Time between piles. Recording begins at the first pile and ends at the last pile of the time period.
- Other - Any time spent before the first pile, after the last pile, during periods that meet the Max travel time in the Show section, or delays or down codes entered in by the operator.