Table Metrics
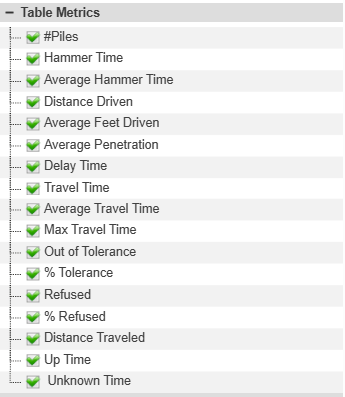
Select the metrics to display in the chart of pile summary data in the bottom panel after submitting the report. All times in HH:MM:SS format.
- #Piles - Total number of as-built piles.
- Hammer Time/Average Hammer Time - Time spent hammering or driving piles. Workflow:
- Enter the Pile Driving screen (start of penetration) starts Hammer time.
- If the pile stops movement, the calculation of Hammer Time stops and no more time is calculated until the operator drives off the pile. Fig 1
- If the pile is driven further after having paused penetration, then all the time is included in the hammer time for that pile. Fig 2
- Distance Driven (ft, meters) - Total distance that the machine drove piles.
- Average Feet Driven (ft, meters) - Average distance that the machine drove piles.
- Average Penetration (ft, meters per second) - The average penetration rate of all hammer time.
- Delay Time - Time in a Carlson Grade delay.
- Travel Time/Average Travel Time/Max Travel Time - Time spent traveling between piles. This is triggered when the machine drives 1 ft off the pile.
- Out of Tolerance - The number of driven piles that did are not within the tolerances set for the report.
- % Tolerance - The percent of piles that meet the tolerances set for the report.
- Distance Traveled (miles,km) - Distance the machine trams between the first and last piles.
- Uptime - All of the time that Carlson PD Grade is on.
- Unknown Time - Any time that is not hammer time, not travel time, and not delay time. This consists mainly of time prior to the first pile and after the last pile or time between piles that exceeds the max travel time.
- Refused - Total number of piles that met the tolerance for refusal.
- % Refusal - Percent of piles that met the tolerance for refusal.
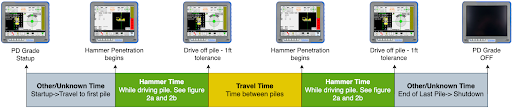
Fig 1
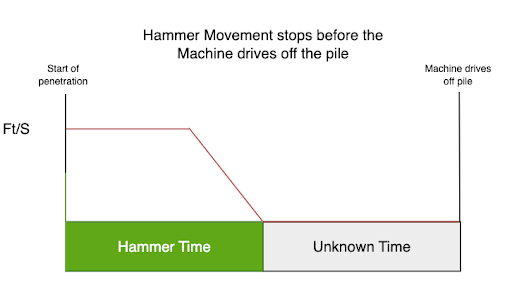
Fig 2a
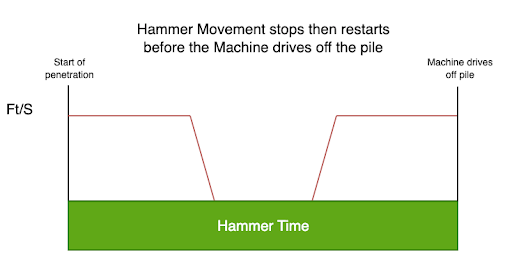
Fig2b